间作具有增产[1-2]和提高资源利用率[3-5]、提高根际微生物群落功能多样性[6-8]、增加农田生物多样性和稳定性[9]、改善土壤肥力[10]、控制病虫害[11-13]等优势,因此间作在许多国家和地区广泛应用[14-16]。在我国现有的100多种间作模式中,约有70%以上的间作体系都有豆科作物参与,其中豆科禾本科间作是最成功的组合。在豆科禾本科间作体系中,由于禾本科作物对土壤氮素的竞争可促进豆科作物自身的生物固氮,进而拓宽了氮素营养的生态位,为禾本科增加了氮素来源,一定程度上降低种间竞争[8],从而提高间作系统的氮素利用效率[17-20],因此,与单一种植相比,禾豆种间氮营养的互补利用机制和氮素来源多样性[1,21-22],为间作体系氮肥的减施奠定了基础。
氮素是影响植物生长最重要的营养元素,是植物生长代谢的关键限制因子。在现代农业生产中,施氮肥是提高作物生产力的普遍措施,但过量的氮肥施用带来一系列环境风险。在豆禾间作体系,豆科可为禾本科提供一定量的氮素[19,21],减轻禾本科对土壤氮资源的过度消耗,对减少氮肥用量和促进土壤可持续利用以及建立环境友好型农业也具有现实意义。
小麦蚕豆间作体系是云南乃至西南、西北地区广泛种植的一种作物种植模式。大量前期研究证实,小麦蚕豆间作能够显著提高作物产量,尤其是显著提高小麦的籽粒产量[1,7,23-24],然而间作条带内,随着与蚕豆距离的增加间作小麦的生长及产量形成会有怎样的变化,其对氮肥施用的响应如何,目前未见相关报道。为此本试验通过研究不同氮水平条件下小麦蚕豆间作体系中不同行小麦的生长及产量特征,阐明不同氮水平下小麦蚕豆间作体系的产量优势形成机制,以期为豆科禾本科间作体系氮肥的合理施用提供理论依据。
1 材料和方法
1.1 试验地点与试验材料
田间试验在云南省昆明市寻甸县大河桥试验基地进行,地理坐标N 23°32′、E 103°13′,地处北亚热带季风气候带,年平均降雨量1 020 mm,年平均气温14.7 ℃。
田间试验于2014年10月建立,前茬作物为水稻,供试土壤为熟化程度较高的红壤。2014年田间试验建立时土壤有机质含量35.05 g/kg、全氮含量1.4 g/kg,碱解氮80 mg/kg,速效钾146 mg/kg,有效磷17 mg/kg,pH值7.18。每年田间试验于10月中下旬播种,4月中旬收获,收获后秸秆移出试验田,5-9月保持休耕,本试验为2017,2018年2 a田间试验,试验期内的温度和降雨如表1所示。2018年田间试验布置前,各试验处理和种植模式下土壤有效氮含量见表2。
供试品种:小麦品种为云麦52 (Triticum aestivum L.),蚕豆品种为玉溪大粒豆(Vicia faba L.)。
供试肥料:尿素(含 N 46.0%),普通过磷酸钙(含 P2O5 16.0%),硫酸钾(含 K2O 50.0%)。
表1 2017-2018年田间试验月均温度和降雨量
Tab.1 Monthly average temperature and rainfall during the field experiment period in 2017 and 2018

月份Month温度/℃ Temperature降水/mm Rainfall2017-20182018-20192017-20182018-20191015.314.8230.758.01112.111.5129.90.0129.310.338.223.218.09.620.040.528.913.30.40.0314.014.522.10.1416.718.645.516.2
表2 2018年田间试验播种前有效氮含量
Tab.2 Available nitrogen content before sowing in field trials in 2018 mg/kg

种植模式Planting patternN0N1N2N3单作小麦Monoculture wheat74.385.598.3103.4单作蚕豆Monoculture faba bean89.694.294.997.0小麦//蚕豆Wheat and faba bean intercropping87.693.8103.1102.4
1.2 试验设计
试验为两因素设计(A、B):A为3种种植模式,即小麦、蚕豆单作和小麦蚕豆间作;B因素为4个氮水平,即N0、N1、N2和N3,其中N0为不施氮,N1为小麦低氮处理,施氮量90 kg/hm2,N2为小麦正常施氮处理,施氮量180 kg/hm2,N3为小麦高氮处理,施氮量270 kg/hm2。所有处理中,间作蚕豆施氮量均为小麦的 1/2,即施氮量分别为:0,45,90,135 kg/hm2。田间试验采用随机区组布置,每处理设3次重复,共36个小区,小区面积为 5.4 m×6.0 m=32.4 m2。
1.3 田间管理
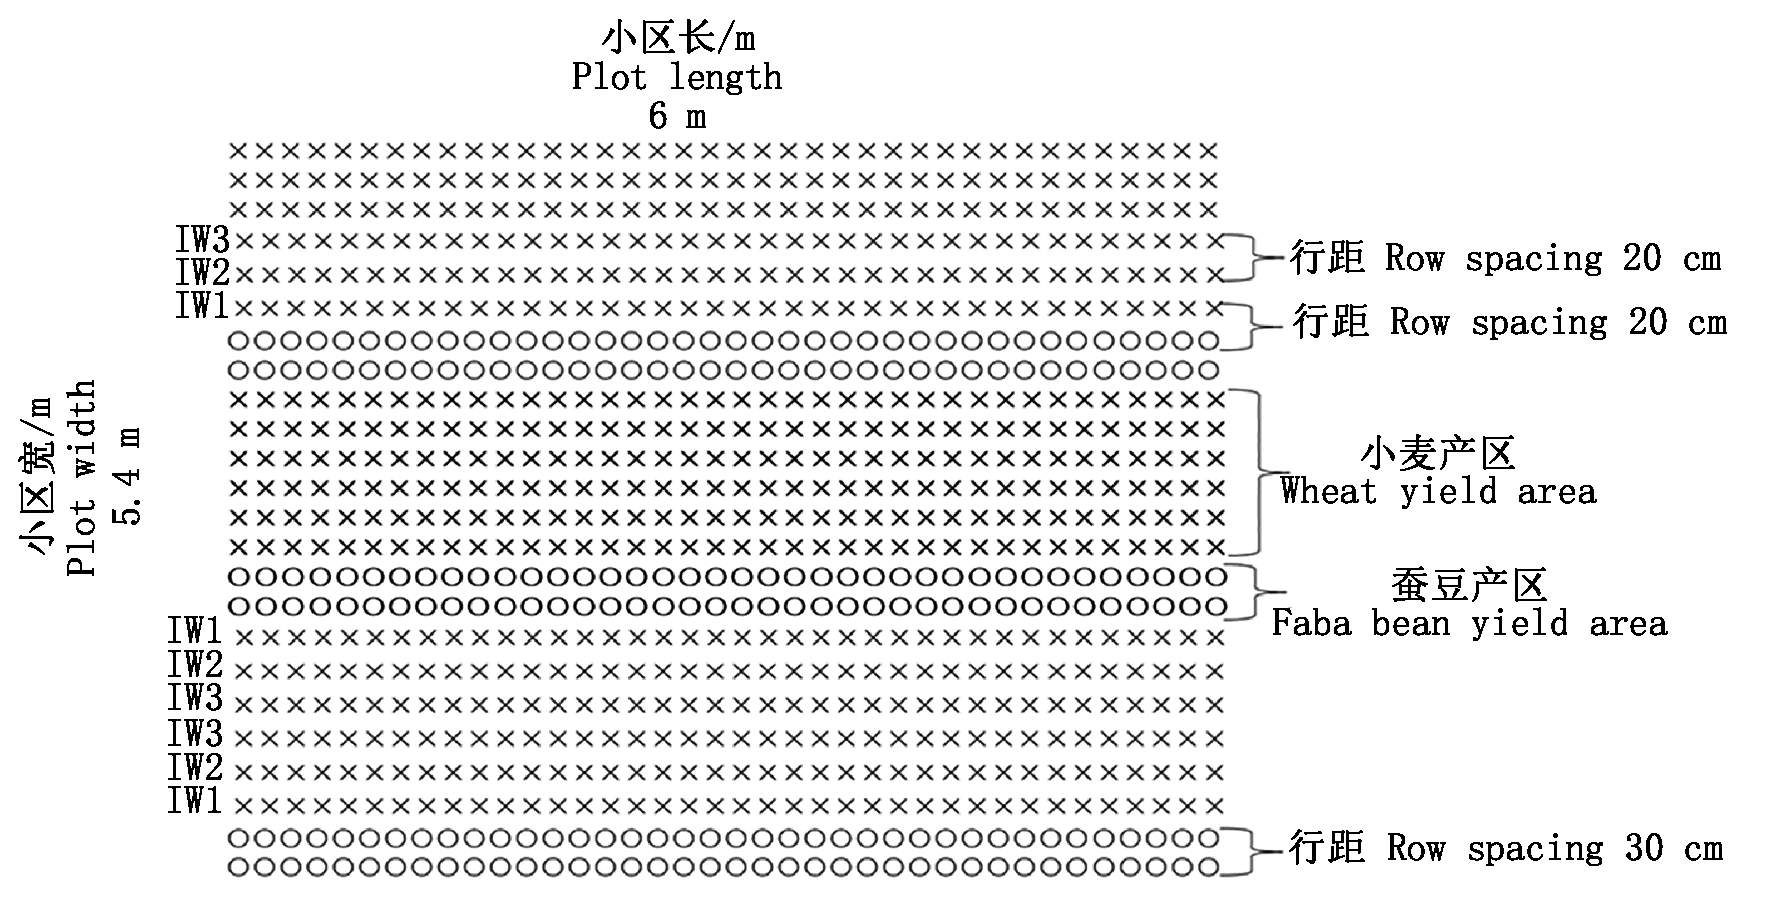
小麦蚕豆分别于 2017,2018年 10 月 20-22日播种,于次年的4 月 20 日收获。小麦条播,行距 0.2 m,蚕豆点播,行距 0.3 m,株距 0.10 m。小麦蚕豆间作小区的种植参照当地推荐种植模式,小区分为 3 个种植条带,小麦蚕豆行数比例为3∶1,即 6 行小麦//2 行蚕豆//6 行小麦//2 行蚕豆//6行小麦//2 行蚕豆。单作小麦每小区27行(中间9行为产区);间作小区小麦共18行(中间条带6行为产区),蚕豆6行(中间条带2行为产区);单作蚕豆每小区18行(中间6行为产区);单间作小麦播种密度同单作小区。间作小区详细种植模式如图1所示。
试验处理磷、钾肥施用量均为 90 kg/hm2,作为基肥一次性施入。小麦的氮肥施用分2次,1/2 作为基肥施入,1/2 在小麦拔节期作为追肥施入。蚕豆不追氮肥,一次施入,田间试验日常管理参照当地田间常规管理。

IW1.临近蚕豆的间作第一行小麦;IW2.距离蚕豆稍远的第2行小麦;IW3.距离蚕豆最远的间作第3行小麦。图2-5同。 IW1.The first row of wheat near intercropping faba bean; IW2.The second row of wheat slightly farther from faba bean; IW3.The third row of wheat farthest from intercropping faba bean.The same as Fig.2-5.
图1 小麦蚕豆间作田间示意图
Fig.1 Wheat and faba bean intercropping in the field
1.4 样品采集与测定
小麦生物量采集与测定:小麦采样以点计,每点采样面积 0.2 m×0.2 m,每小区采集 3 点,在小麦分蘖、拔节、抽穗、灌浆、成熟5个生育期采取单间作小麦地上部植株样品,采样后在 105 ℃下杀青 30 min,75 ℃烘干称质量。
小麦和蚕豆籽粒产量测定:在小麦和蚕豆成熟期,采集测定测产区小麦和蚕豆产量。
1.5 数据分析
1.5.1 Logistic生长模型 Logistic生长模型能够模拟作物开始生长到收获或死亡的全过程[25-26]。采用Origin 8.0 软件通过逻辑斯蒂增长模型(Logistic)模拟单间作小麦的关键生长参数、生物量的累积动态及生长速率动态。具体模型如下[26-27]:
ri=r×yt(1-yt/A)
其中,yt表示小麦整个生育期某天的地上部生物量,单位:kg/hm2;A表示小麦地上部最大生物量,单位:kg/hm2;r为小麦的初始生长速率,代表小麦的生长潜力,单位:kg/(hm2·d);Tmax表示小麦达到最大生长速率需要的时间,单位:d;t 表示小麦生长的时间,单位:d;rt表示小麦整个生育期中某天的生长速率,单位:kg/(hm2·d)。
本研究以土地当量比(LER)作为间作优势指标,公式如![]()
式中:YIW和YIF分别为间作小麦和间作蚕豆小区产区产量;YMW和YMF则分别为单作小麦和单作蚕豆小区产区产量。 LER>1表示间作比单作具有产量优势; LER<1表示间作比单作没有产量优势。
1.5.2 方差分析 数据采用Microsoft Excel 2010 软件进行处理,采用 SPSS 20.0 软件用两因素方差分析处理产量数据和关键生长参数;单因素方差分析方法分析不同氮水平下LER、单间作小麦生长速率和生物累积量的差异。用最小显著差异法(Duncan),检验各处理的差异显著性(P=0.05)。
2 结果与分析
2.1 不同氮水平下间作对小麦产量的影响
从表3可以看出,小麦蚕豆间作具有产量优势(LER>1)(除N3水平),且LER随氮水平提高而降低。小麦蚕豆间作产量优势的形成主要是由于间作提高了小麦产量,在N0、N1、N2水平下,间作提高小麦产量25.0%,19.8%,9.4%,平均达18.1%,增产效果显著;与单作蚕豆相比,间作却降低了蚕豆产量,4个氮水平下,降幅为10.0%~19.7%。
表3 2017-2018年小麦和蚕豆的产量
Tab.3 Yield of wheat and faba bean in 2017-2018

处理Treatment小麦产量/(kg/hm2)Yield of wheat蚕豆产量/(kg/hm2)Yield of faba bean2017201820172018LER(2017)LER(2018)N0M1 476±164g2 261±101f2 930±184bc2 685±192b1.15±0.07a1.11±0.08aI1 893±144f2 752±131e2 557±188d2 375±124bcN1M2 756±118e3 545±254d3 514±141a3 291±292a1.08±0.02ab1.08±0.05aI3 286±171d4 264±208c2 991±72bc2 706±254bN2M4 598±233c5 562±227b3 075±98b2 600±143bc1.03±0.06bc1.03±0.07abI5 063±242b6 040±206a2 674±164cd2 340±124bcN3M5 863±359a6 238±385a2 395±342d2 247±209c0.95±0.06c0.94±0.04bI5 988±282a6 306±218a1 926±226e1 805±269d
注:M.单作;I.间作;间作小麦产量是间作3行小麦的平均产量;LER以作物产区产量结算。
Note: M.Monoculture; I.Intercropping; The yield of intercropping wheat was the average of three rows in intercropping; LER is settled by the yield of production area.
深入分析2 a的间作小麦产量发现(图2),与单作小麦相比,N0、N1、N2水平下,间作显著提高第一行小麦产量36.0%,32.6%,20.0%,平均达29.5%,间作还显著提高第2行小麦产量30.9%,18.5%,10.0%(除2018年N2水平下第2行外),平均达19.7%。但间作第3行小麦产量与单作相比无显著差异。

MW.单作小麦;不同字母表示不同氮水平下单间小麦产量差异显著(P<0.05)。图3-5同。 MW. Monocropping wheat; Different letters are significantly different between inter-and mono-cropped wheat under different N levels(P<0.05). The same as Fig.3-5.
图2 不同氮水平下单间作小麦的产量
Fig.2 Yield of inter-and mono-cropped wheat under different N levels
2.2 不同氮水平下间作对小麦关键生长参数的影响
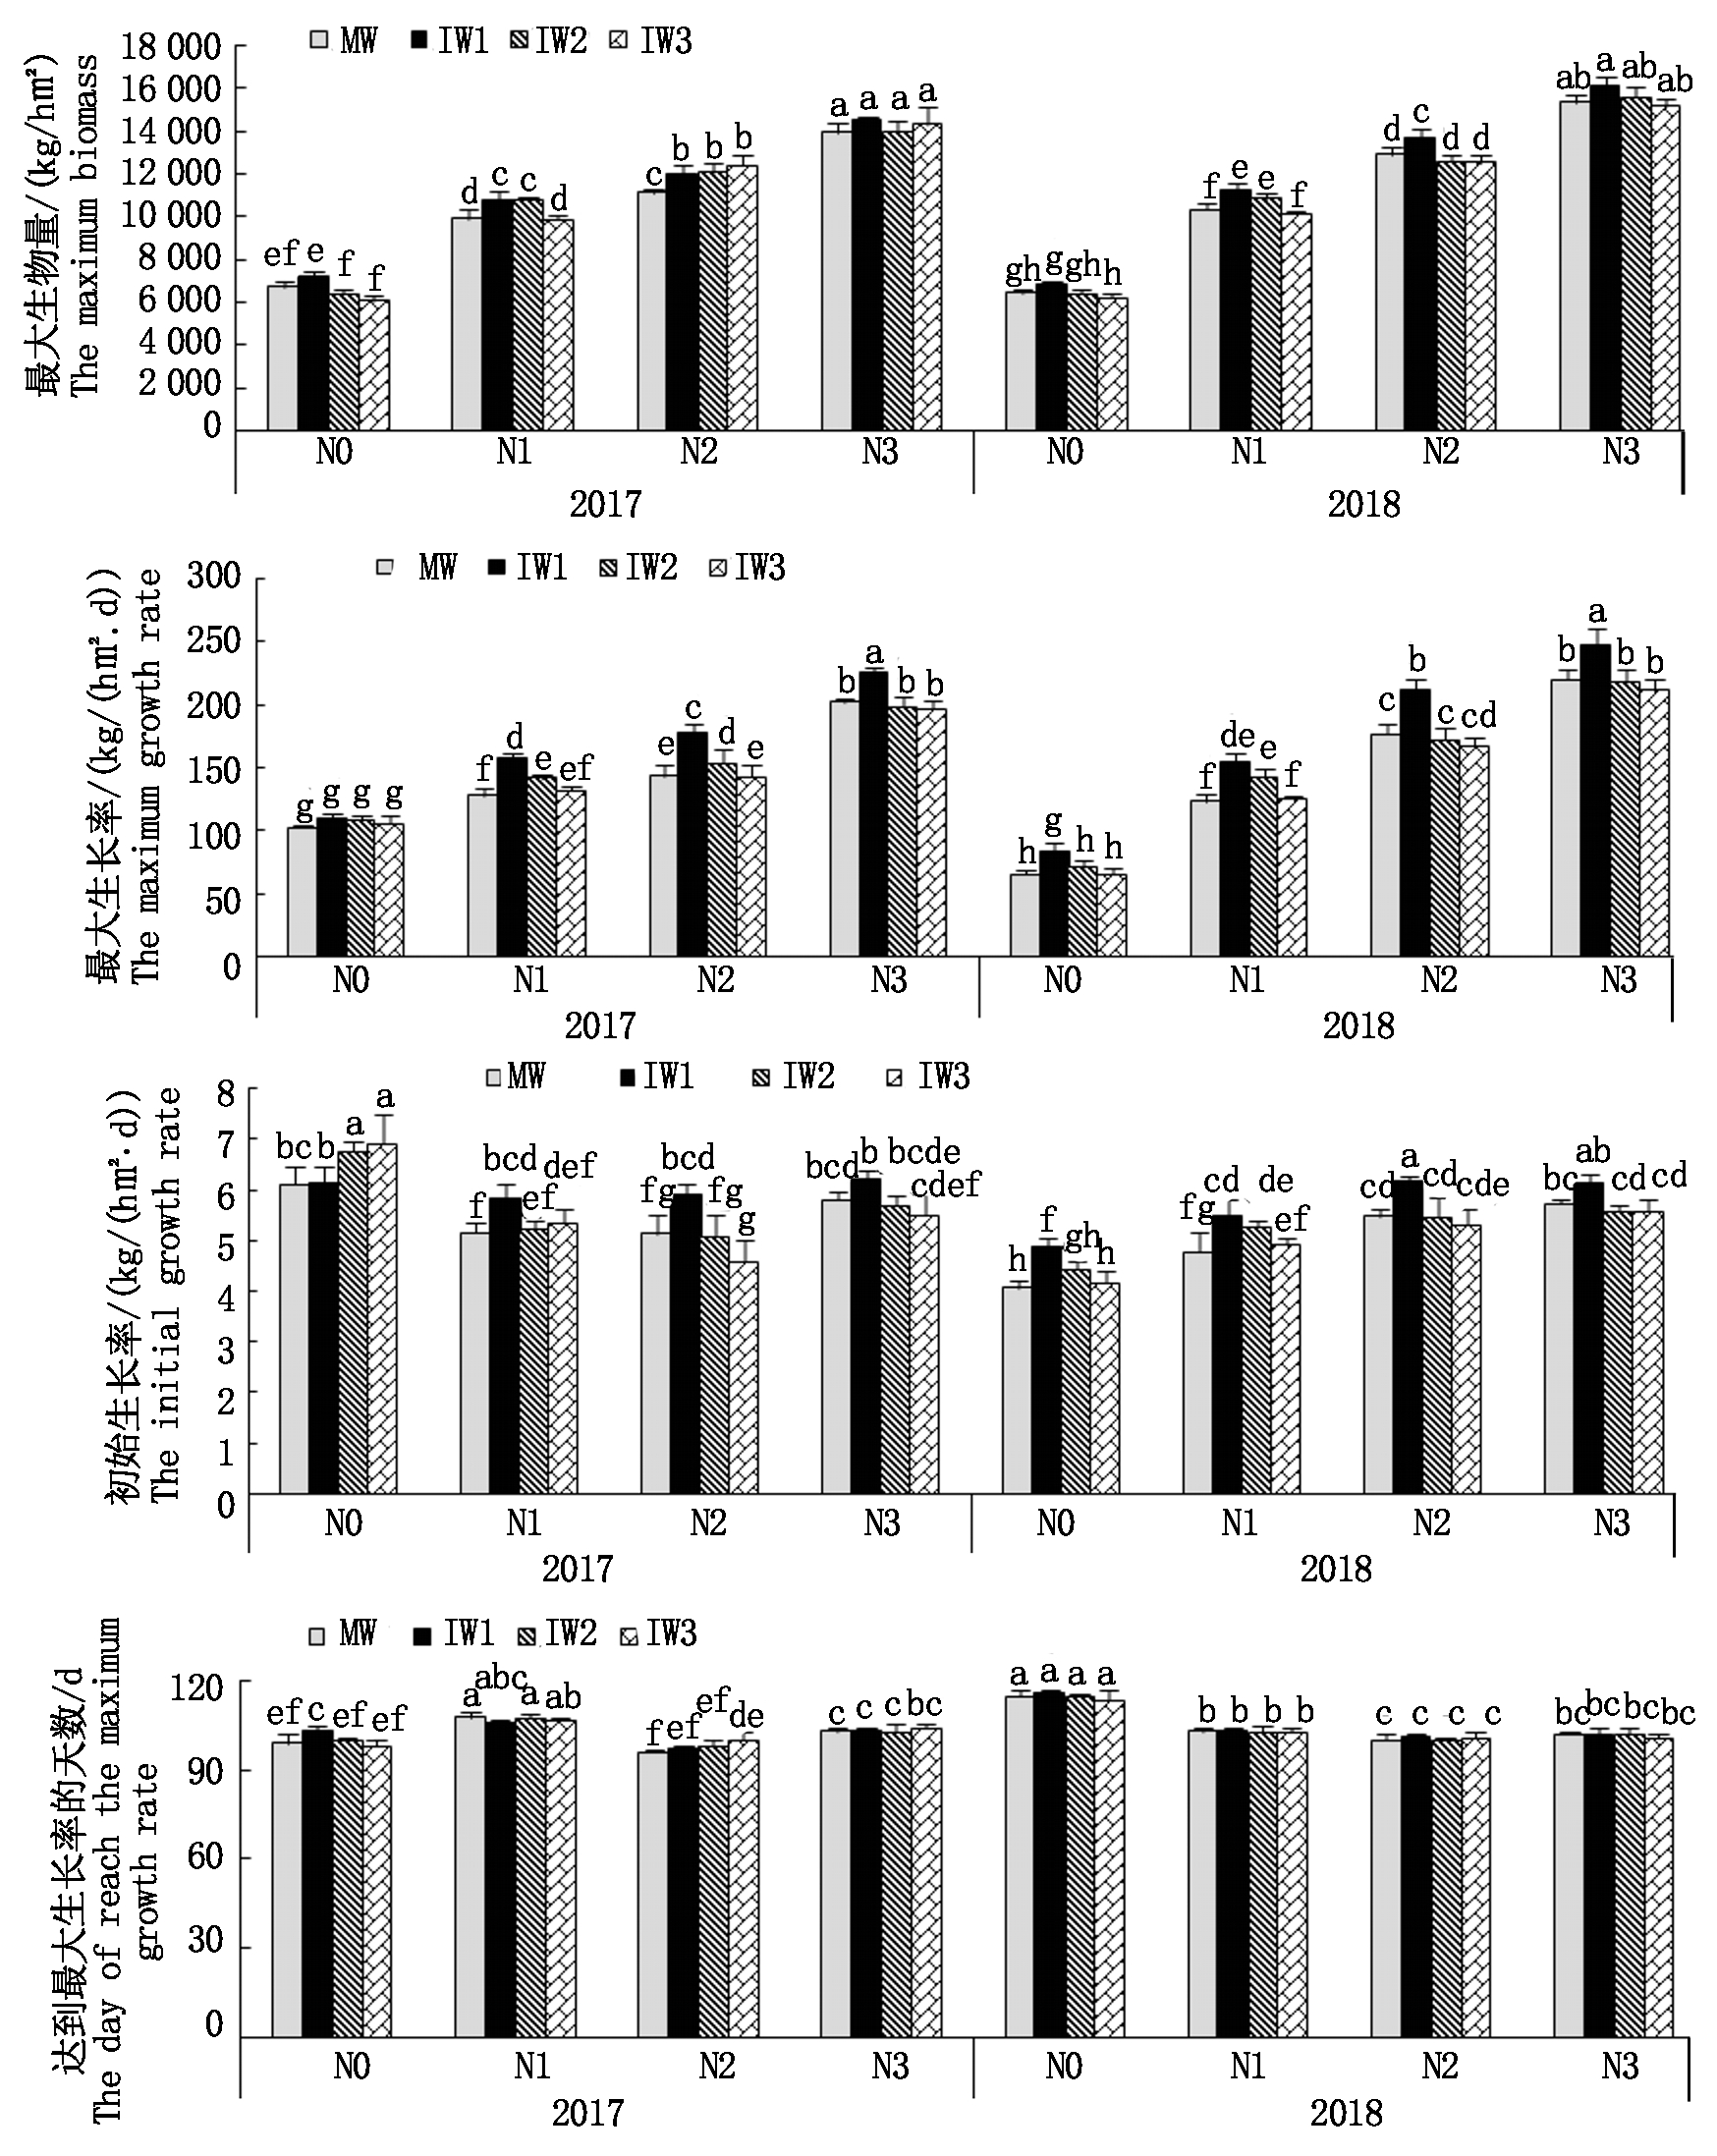
Logistic模型较好的拟合了不同氮水平下单间作小麦的生长动态,校正的R2=0.968~0.998(P<0.000 1)(表4)。通过Logistic增长模型很好地模拟了单间作小麦的关键生长参数(图3)。
由表5可看出,小麦的最大生物量(A)和最大生长速率(Rmax)受氮水平、种植模式和氮水平×种植模式(2018年除外)的显著调控;小麦达到最大生长速率的时间(Tmax)主要受氮水平和氮水平×种植模式(2018年除外)的影响;初始生长速率(r)主要受氮水平、种植模式(2017年除外)和氮水平×种植模式(2018年除外)的影响。
2 a的研究结果(图3)得到,就小麦A而言,N0水平下表现为间作不同行小麦之间的差异,相比IW2和IW3,间作使得IW1的A分别平均显著提高12.4%(仅2017年)和13.9%;N1和N2水平下IW1的A比MW分别提高8.7%和7.0%,平均达7.9%;同时,2 a的N1及2017年的N2水平下IW2的A也相较MW分别提高7.1%和8.5%,平均达7.8%;N3水平下,单间作小麦并无显著差异。
表4 Logistic模型拟合的小麦的生长动态的校正决定系数R2 (2017-2018)
Tab.4 Adjust-R2 of wheat growth dynamics simulated by logistic model (2017-2018)

处理Treatment20172018MWIW1IW2IW3MWIW1IW2IW3N00.9970.9980.9850.9700.9780.9680.9890.972N10.9960.9970.9910.9940.9850.9880.9870.980N20.9960.9910.9970.9930.9830.9900.9850.977N30.9860.9850.9820.9830.9900.9880.9910.990
表5 不同氮水平下单间作小麦关键参数统计分析结果(2017-2018)
Tab.5 Statistical analysis of key parameters of inter-and mono-cropped wheat under different N levels(2017-2018)

处理Treatment20172018ATmaxr(×10-2)RmaxATmaxr(×10-2)Rmax氮水平N level∗∗∗∗∗∗∗∗∗∗∗∗∗∗∗∗∗∗∗∗∗∗∗∗种植模式Planting pattern∗∗NSNS∗∗∗∗∗∗NS∗∗∗∗∗∗氮水平×种植模式∗∗∗∗∗∗∗∗∗NSNSNS∗N level×Planting pattern
注:A.最大生物量;Tmax.达到最大生长速率所需的时间;r.最初生长速率;Rmax.最大生长速率;*.在P<0.05下存在显著差异;**.在P<0.01下存在显著差异;***.在P<0.001下存在显著差异;NS.无显著差异。
Note: A.The maximum biomass; Tmax.The time needed to reach the maximum instantaneous growth rate;r.The initial growth rate; Rmax.The maximum growth rate; *.Significant difference at P<0.05; **.Significant difference at P<0.01; ***.Significant difference at P<0.001; NS.No significant difference.

图3 不同氮水平下单间作小麦关键生长参数
Fig.3 Key growth parameters of inter-and mono-cropped wheat under different N levels
从Rmax来看,间作显著提高了IW1的Rmax。N0~N3水平下(除2017年N0外),IW1的Rmax比MW分别显著提高了26.9%,24.3%,21.9%,12.0%,平均达21.3%(其中除去N3,则平均达24.4%)。2 a结果还发现,与MW相比,2 a的N1及2017年的N2水平下IW2的Rmax分别增长13.5%及7.7%,平均达10.6%;4个氮水平下的IW3的Rmax与MW均无显著差异。
从r来看,N1和N2水平下,IW1比MW分别有14.4%,14.0%的显著提高;N0水平下,2017年IW2和IW3显著大于MW和IW1,但2018年则是IW1显著大于MW,增幅达20.0%,因此,N0、N1和N2水平下,IW1比MW平均提高达16.1%(除2017年N0外);N3水平下主要表现为IW1显著大于IW3。
Tmax并不受种植模式的调控(2017年N0和N2除外),2017年N0水平下IW1的Tmax比MW显著提高5.0%,而2017年N2水平下IW3的Tmax比MW显著提高4.2%。
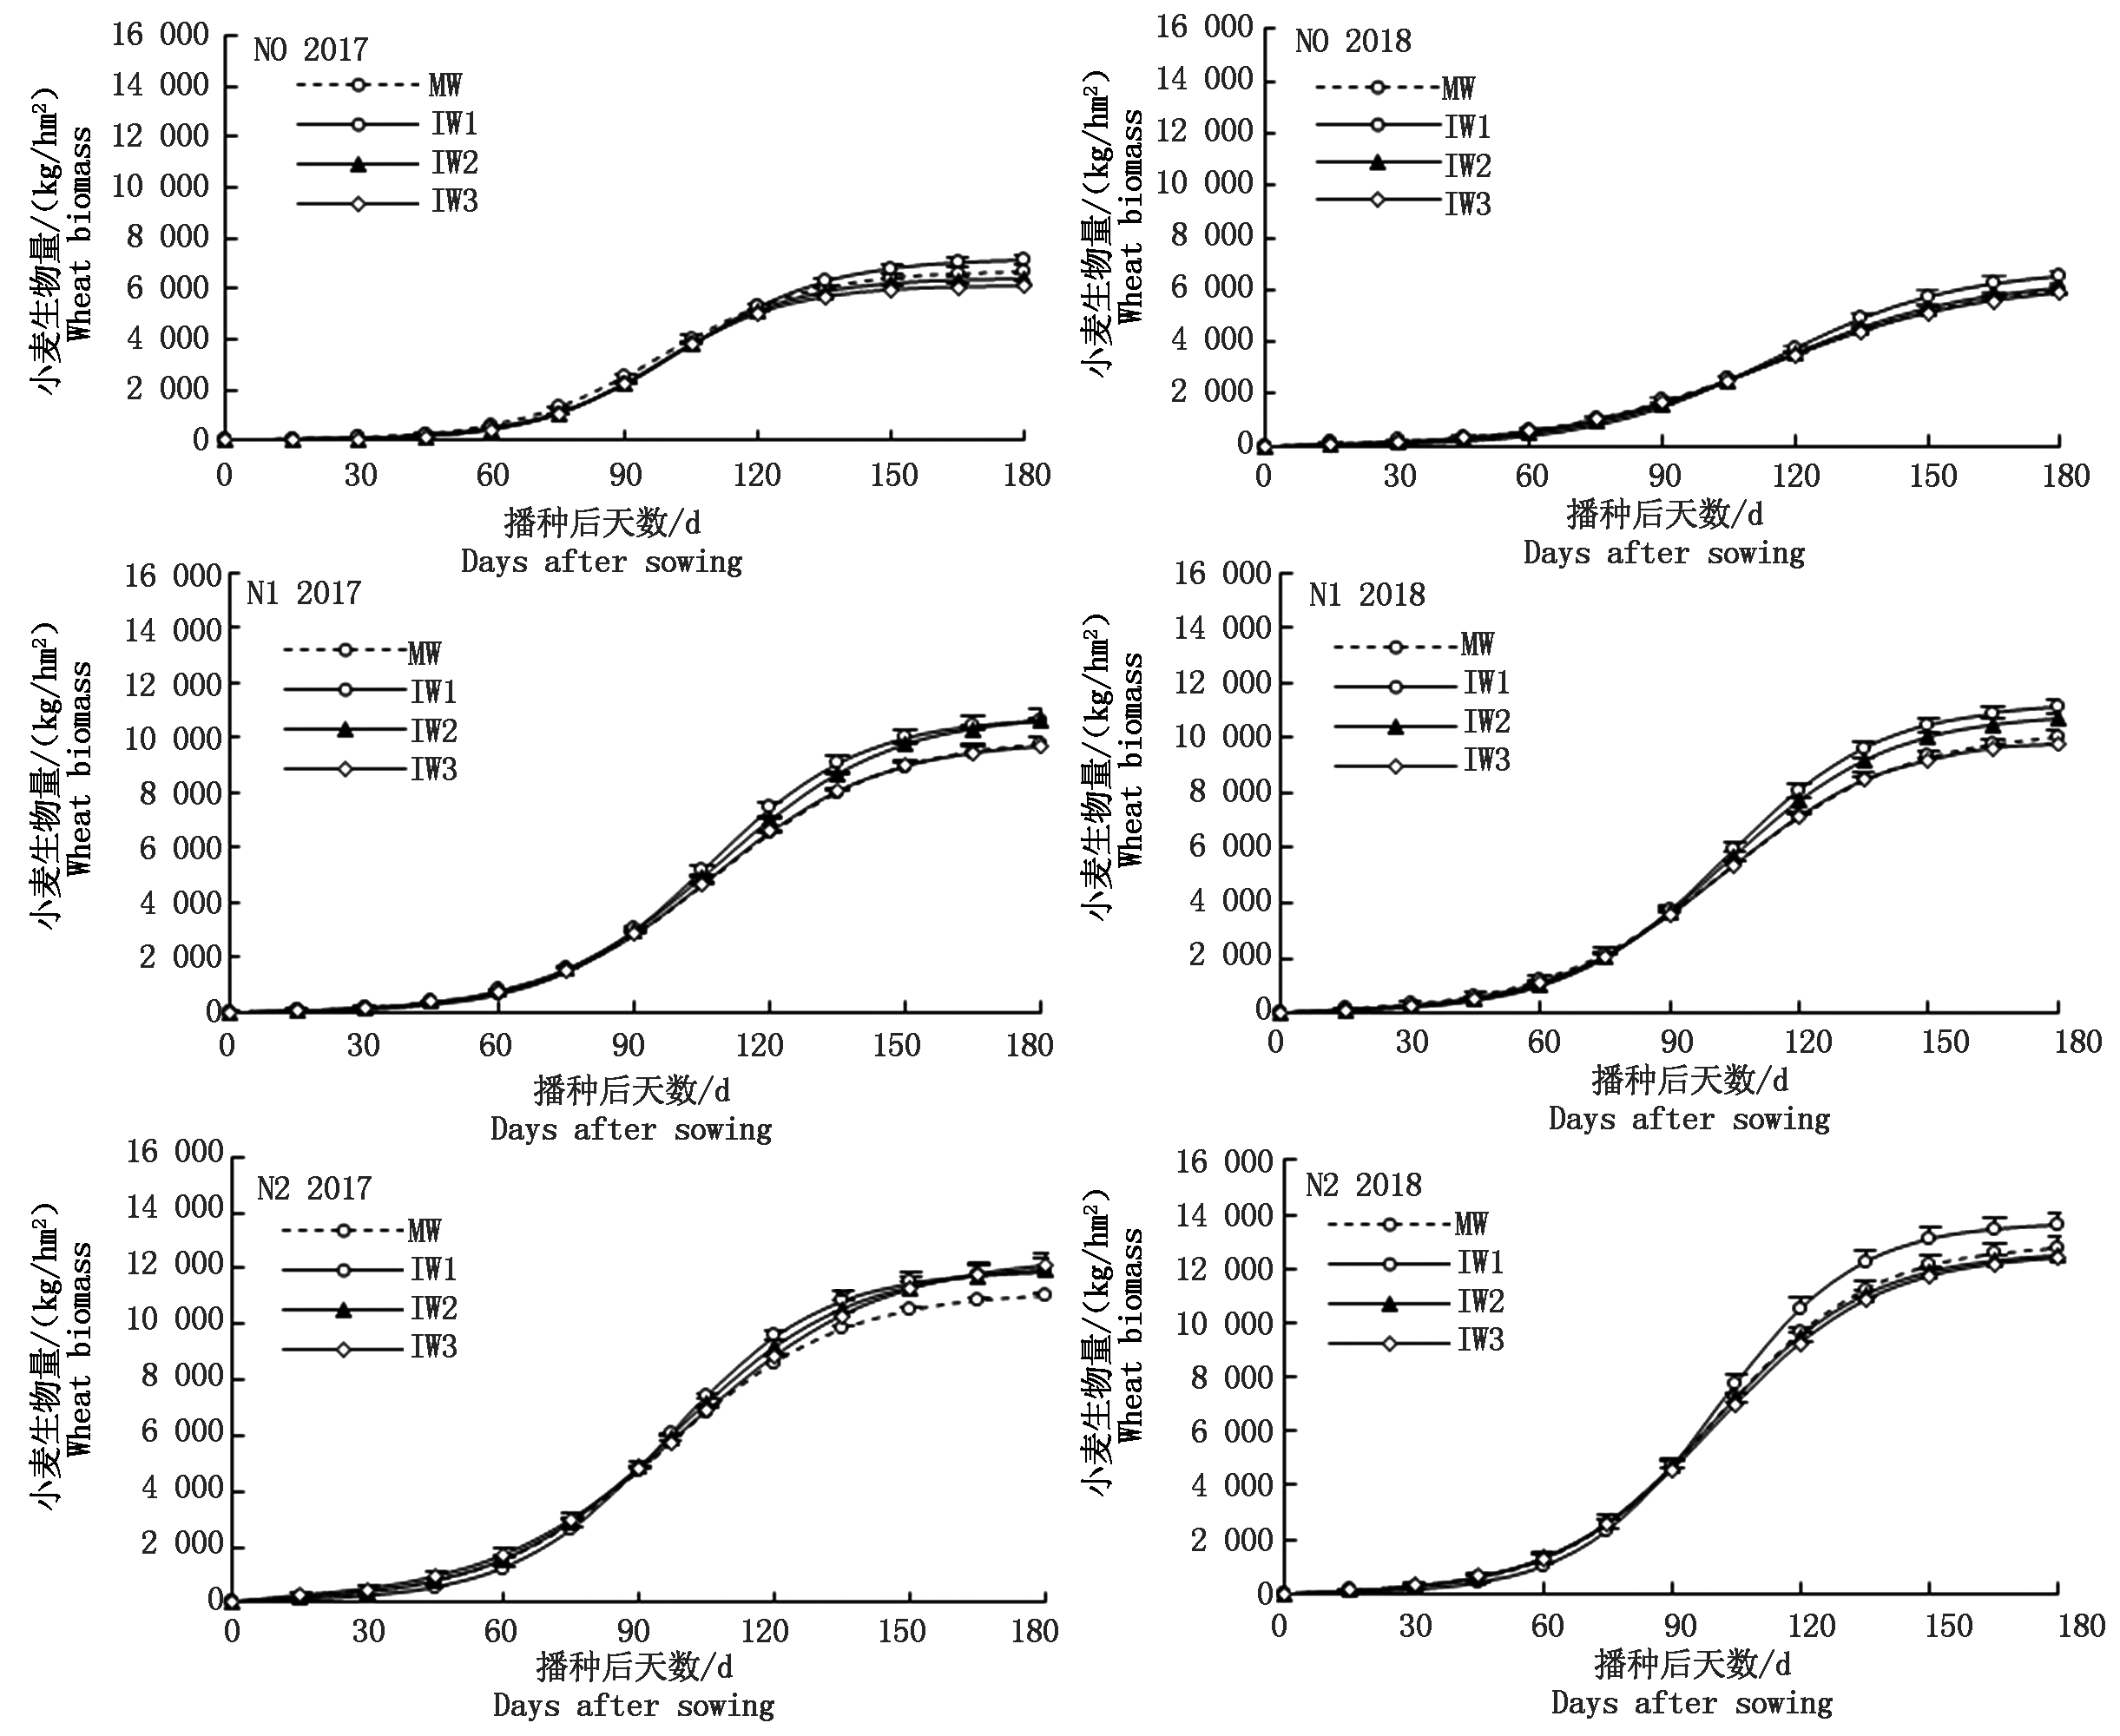
2.3 不同氮水平下单间作小麦的生物量累积动态
2 a的研究(图4)表明,施氮量显著影响单间作小麦地上部生物量的累积。在小麦的营养生长阶段(播种90 d内),2017年的N0、N1、N2水平下,间作主要抑制了IW1生物量的累积;2018年仅N0水平下,间作抑制了IW1生物量的累积。在小麦生殖生长阶段(播种90 d以后),4个氮水平下单间作小麦地上部生物量均存在显著差异,N0~N3水平下,间作均提高了IW1生物量的累积,且N1及2017年N2水平下,间作还显著促进了IW2生物量的累积,但是4个氮水平下,IW3和MW相比无差异(除2017年N0和N2外)。


同一氮水平下同一时期不同字母表示单间作小麦差异显著(P<0.05),每列字母从上至下 分别代表MW、IW1、IW2、IW3的差异性分析结果。图5同。 Different letters in the same period indicate significant differences between inter-and mono-cropped wheat under the same N levels(P<0.05); Each column of letters represents the difference analysis results of MW, IW1, IW2 and IW3 from top to bottom. The same as Fig.5.
图4 不同氮水平下单间作小麦的生物量累积
Fig.4 Biomass accumulation of inter-and mono-cropped wheat under different N levels
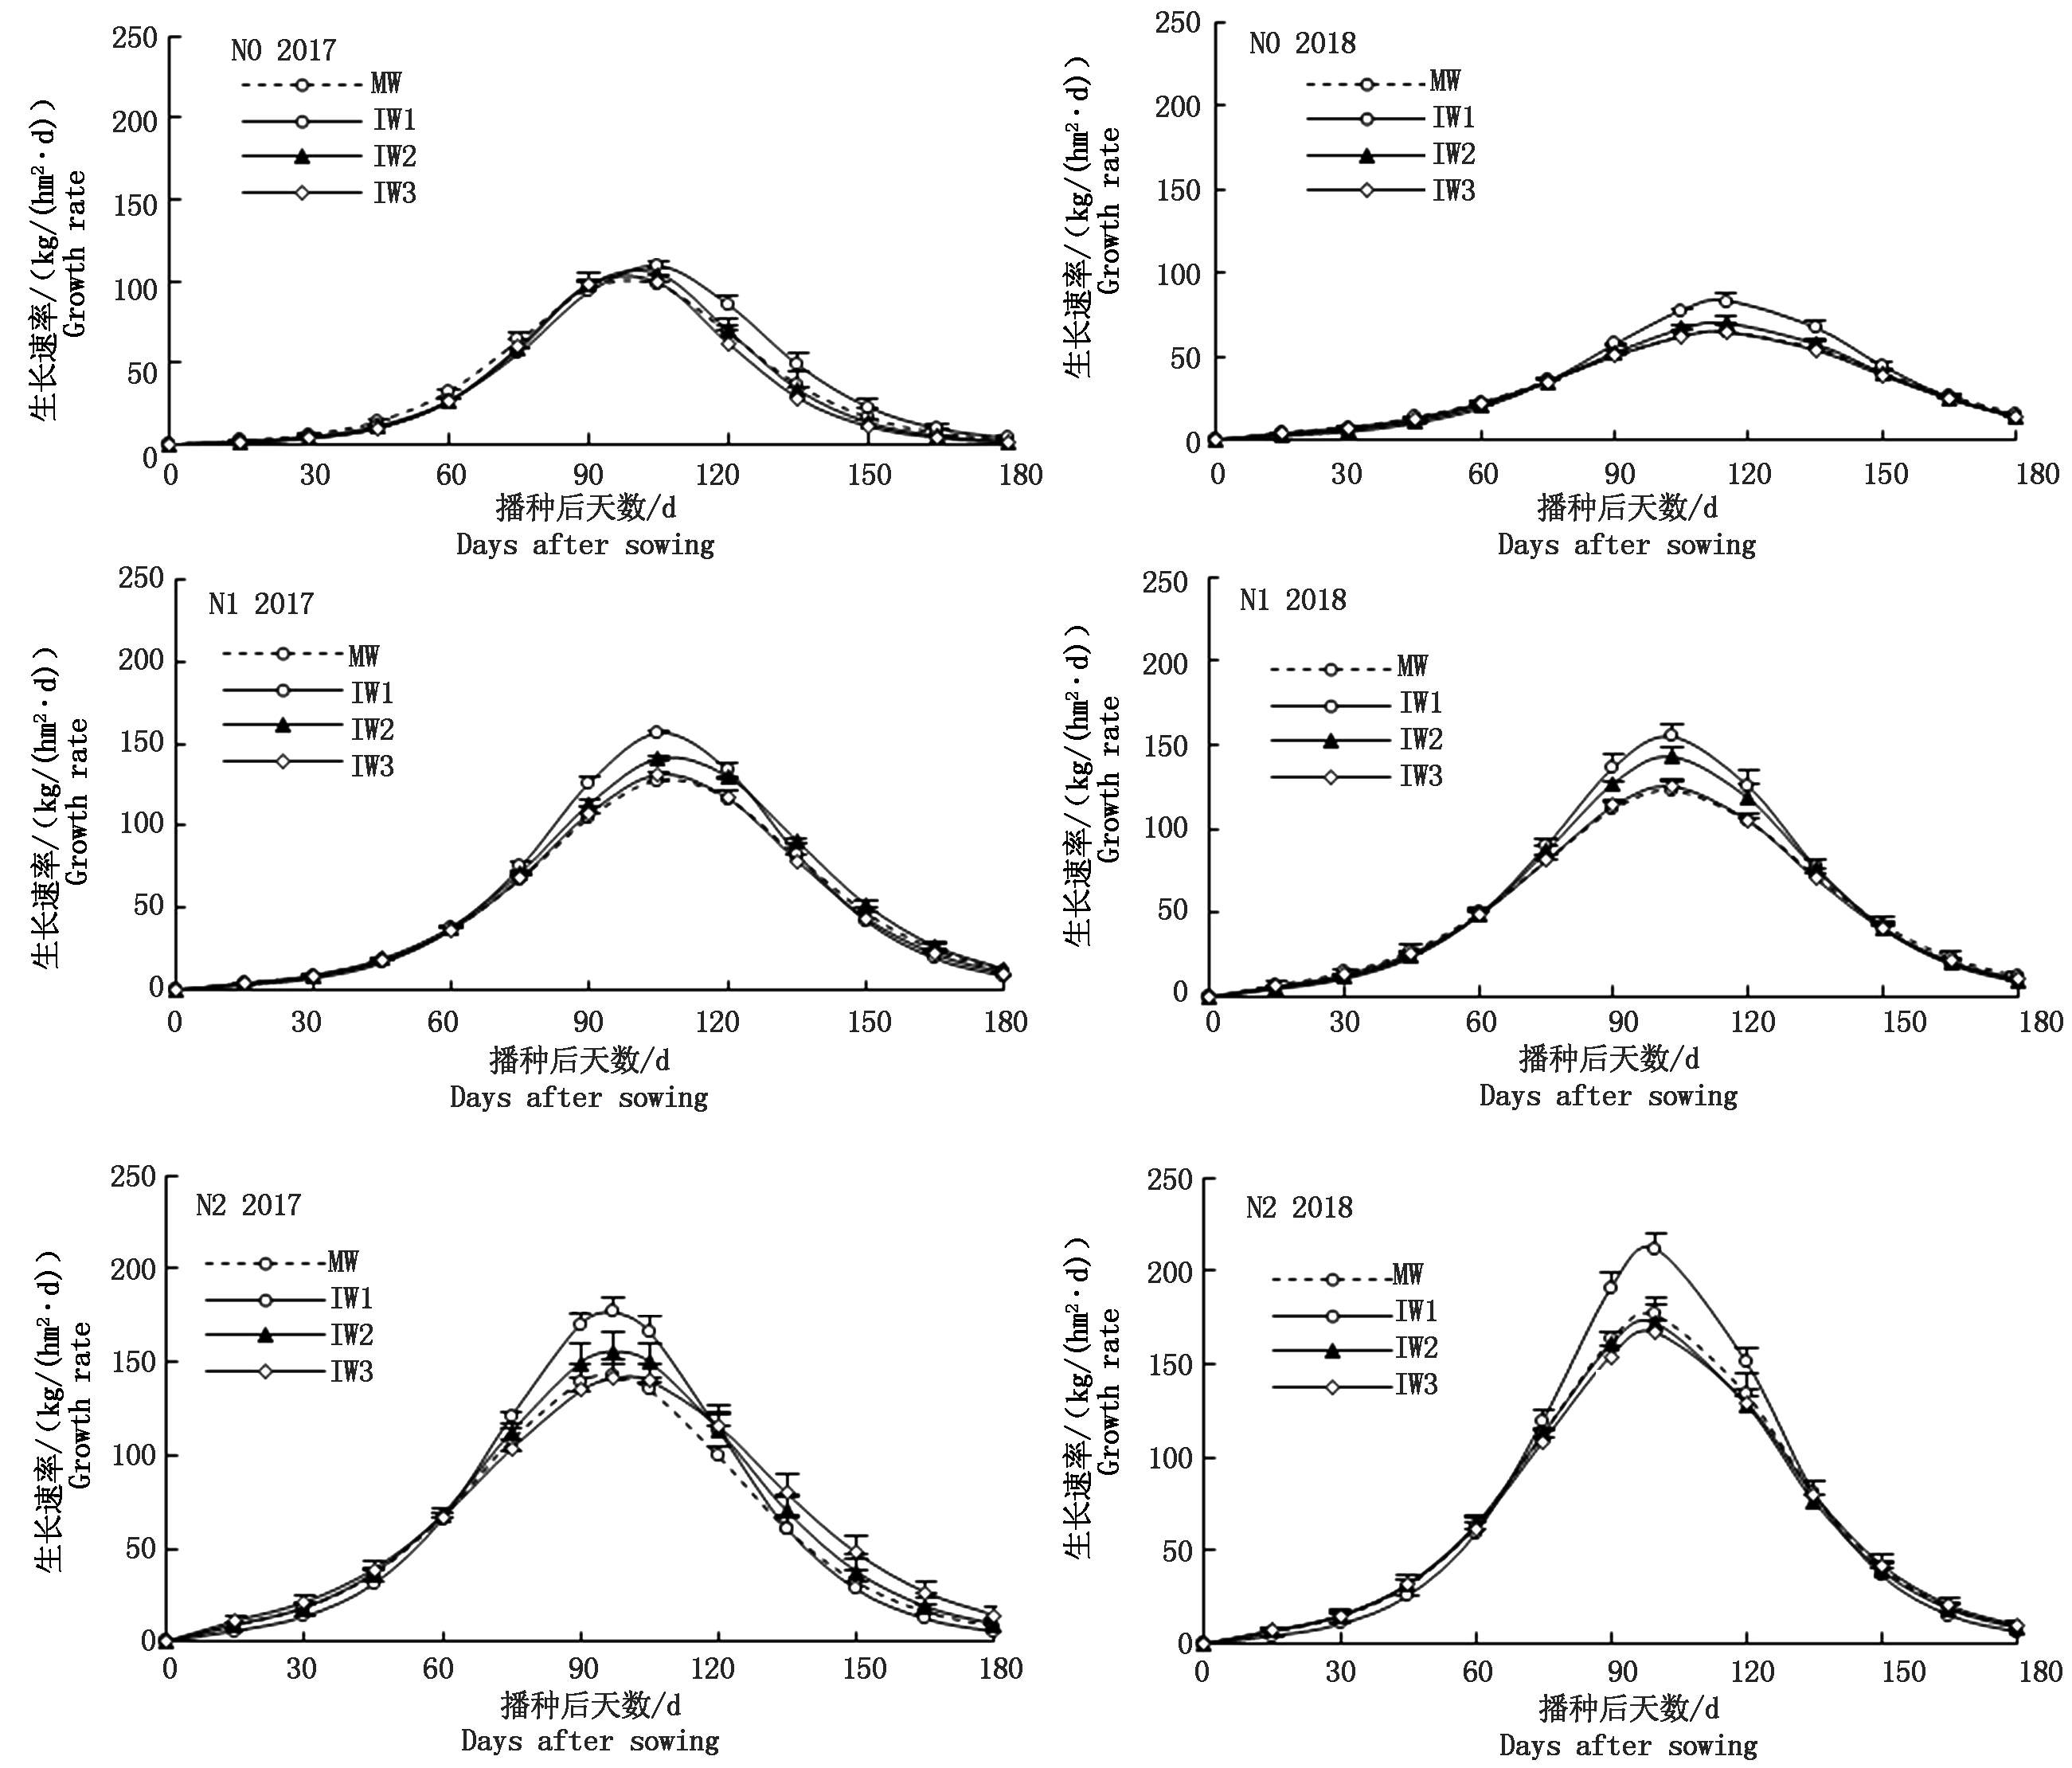
2.4 不同氮水平下单间作小麦的生长动态
由图5 可知,随施氮量的增加小麦生长速率高峰显著提高。4个氮水平下,单间作小麦基本上在播种后103 d左右达到生长最高峰;其中2017年N2和2018年N0水平分别在播种后98,115 d左右达到生长最高峰。
N0水平下,播种后15~60 d内MW的生长速率显著高于IW1;进入生殖生长阶段(播种90~180 d),与MW、IW2、IW3相比,播种后105~120 d(2017年)和90~135 d(2018年)间作显著提高了IW1的生长速率,为小麦生物量和产量的累积奠定基础。


图5 不同氮水平下单间作小麦生长速率
Fig.5 Growth rate of inter-and mono-cropped wheat under different N levels
N1水平下,与MW和IW3相比,播种后90~120 d间作显著提高了IW1、IW2的生长速率,这一结果与小麦地上部生物累积量相符。
N2水平下,2 a结果存在一定差异,2017年播种后15~45 d IW1生长速率低于其他三者,而在播种后90~105 d,间作显著提高了IW1生长速率,使得IW1生长速率与其他三者的差异达到显著水平;而2018年则主要是IW1在90~120 d生长高峰期显著大于IW2、IW3和MW。
N3水平下,播种后90~105 d间作使得IW1的生长速率显著提高。
3 讨论
间作边行优势是作物产量提高的关键[29-31];其主要原因是豆科作物固定的氮向非豆科作物转移、种间氮营养生态位分化及豆科作物的氮节约效应促使相邻非豆科作物受益[1,32]。
Rmax和r反映出作物对资源的利用能力和生长潜力,是作物竞争力的关键属性[33];本试验研究发现,在低氮和正常氮肥投入下,间作提高了IW1的A、Rmax和r。说明小麦蚕豆间作体系中,边行小麦具有较强的资源获取能力和竞争能力[26],为边行产量和生物量优势的形成奠定了基础。但本研究也发现,在小麦营养生长前期,IW1在种间竞争中处于劣势,这与李春杰[34]的结果一致,说明小麦和蚕豆的种间竞争和互惠机制随生育期变化而变化,尚需深入研究。
值得注意的是,尽管存在年际波动,在低氮及正常供氮下,间作也提高了IW2的A、Rmax、生长高峰期的生长速率及籽粒产量。这与Li等[30]在玉米间作小麦、大豆间作小麦体系中的发现类似:边行效应和内行积极的种内竞争对生物量增长的相对贡献分别占三分之二和三分之一;这或许与豆科非豆科间作改变根际微生态环境有关[35-37]。Liu等[36]通过盆栽和水培试验发现,小麦蚕豆间作改变了间作蚕豆黄酮分泌的种类和数量,且间作蚕豆黄酮的分泌量受氮水平的调控;因此,在田间条件下,蚕豆分泌某种或某些信号物质改变小麦根际过程必然与间作蚕豆与小麦的距离及氮肥用量密切相关。如前所述,间作边行优势的贡献已经得到证实,而内行效应的积极贡献尚且需要深入探讨。王宇蕴[38]研究表明,小麦蚕豆间作改变了小麦的根系分布和根构型,是否存在IW2根系伸长到IW1的根系分布区域接触到这种信号物质,或是养分胁迫条件下根际过程的显著改变直接影响了IW2的生长和发育,尚且不清楚。
温度和降水,尤其关键生育期温度变化对小麦的生长发育影响较大[39-41]。因此,本试验的产量效应及模拟的小麦关键参数存在年际差异,但是小麦蚕豆间作的产量优势(LER>1)是稳定的,且间作产量优势随施氮量的提高而降低,甚至消失。本研究是多年定位试验的结果,通过4 a小麦蚕豆间作种植,不施氮和减氮投入下,土壤有效氮含量提高了10%~18%。这些结果均证实,在资源不足或耗竭的情况下,豆科非豆科间作是有效地维持作物产量和系统稳定性的手段之一。因此,如何最大程度的发挥豆科禾本科间作优势,积极提高内行的增产效应,应成为今后相关研究重点。
小麦蚕豆间作提高小麦产量18.1%(除N3外),降低蚕豆产量10.0%~19.7%,表现出间作产量优势(LER>1)。但随着施氮量的提高,间作产量优势降低甚至消失。间作提高边行小麦产量20.0%~36.0%,提高第2行小麦产量10.0%~30.9%,是小麦蚕豆间作产量优势形成的关键。间作显著提高边行和第2行小麦的Rmax、提高小麦旺盛生长期的生长速率、促进边行和第2行小麦生殖生长阶段生物量的累积,为间作小麦产量优势的形成奠定了基础。
[1] 肖焱波, 段宗颜, 金航, 胡万里, 陈拾华, 魏朝富. 小麦/蚕豆间作体系中的氮节约效应及产量优势[J]. 植物营养与肥料学报, 2007, 13(2): 267-271. doi:10.3321/j.issn:1008-505X.2007.02.014.
Xiao Y B,Duan Z Y, Jin H, Hu W L,Chen S H, Wei C F. Spared N response and yields advantage of intercropped wheat and fababean[J]. Journal of Plant Nutrition and Fertilizers, 2007, 13(2):267-271.
[2] Li L, Li S M, Sun J H, Zhou L L, Bao X G, Zhang H G, Zhang F S. Diversity enhances agricultural productivity via rhizosphere phosphorus facilitation on phosphorus-deficient soils[J]. PNAS, 2007, 104(27): 11192-11196. doi:10.1073/pnas.0704591104.
[3] Agegnehu G, Ghizaw A, Sinebo W. Yield potential and land-use efficiency of wheat and faba bean mixed intercropping[J]. Agronomy for Sustainable Development, 2008, 28(2): 257-263. doi:10.1051/agro:2008012.
[4] Kermah M, Franke A C, Adjei-Nsiah S,Ahiabor B D K,Abaidoo R C,Giller K E.Maize-grain legume intercropping for enhanced resource use efficiency and crop productivity in the Guinea savanna of Northern Ghana[J]. Field Crops Research, 2017, 213:38-50.doi:10.1016/j.fcr.2017.07.008.
[5] Pypers P, Sanginga J M, Kasereka B, Walangululu M, Vanlauwe B. Increased productivity through integrated soil fertility management in cassava-legume intercropping systems in the highlands of Sud-Kivu, DR Congo[J]. Field Crops Research, 2011, 120(1): 76-85. doi:10.1016/j.fcr.2010.09.004.
[6] 覃潇敏, 郑毅, 汤利, 龙光强. 玉米与马铃薯间作对根际微生物群落结构和多样性的影响[J]. 作物学报, 2015,41(6): 919-928. doi:10.3724/SP.J.1006.2015.00919.
Qin X M, Zheng Y, Tang L, Long G Q. Effects of maize and potato intercropping on rhizosphere microbial community structure and diversity[J]. Acta Agronomica Sinica, 2015, 41(6):919-928.
[7] 董艳, 董坤, 汤利, 郑毅, 杨智仙, 肖靖秀, 赵平, 胡国彬.小麦蚕豆间作对蚕豆根际微生物群落功能多样性的影响及其与蚕豆枯萎病发生的关系[J]. 生态学报, 2013,33(23):7445-7454. doi:10.5846/stxb201208281214.
Dong Y, Dong K, Tang L, Zheng Y, Yang Z X, Xiao J X, Zhao P, Hu G B. Relationship between rhizosphere microbial community functional diversity and faba bean fusarium wilt occurrence in wheat and faba bean intercropping system[J]. Acta Ecologica Sinica, 2013, 33(23):7445-7454.
[8] 宋亚娜, Marschner Petre, 张福锁, 包兴国, 李隆. 小麦/蚕豆,玉米/蚕豆和小麦/玉米间作对根际细菌群落结构的影响[J]. 生态学报, 2006, 26(7):2268-2274. doi:10.3321/j.issn:1000-0933.2006.07.028.
Song Y N, Petre M, Zhang F S, Bao X G, Li L. Effect of intercropping on bacterial community composition in rhizoshpere of wheat (Triticum aestivum L.), maize (Zea mays L.), and faba bean (Vicia faba L.)[J]. Acta Ecologica Sinica, 2006, 26(7):2268-2274.
[9] 李隆. 间套作强化农田生态系统服务功能的研究进展与应用展望[J]. 中国生态农业学报, 2016,24(4): 403-415. doi:10.13930/j.cnki.cjea.160061.
Li L. Intercropping enhances agroecosystem services and functioning: Current knowledge and perspectives[J]. Chinese Journal of Eco-Agriculture, 2016,24(4):403-415.
[10] Fustec J, Lesuffleur F, Mahieu S, Cliquet J B. Nitrogen rhizodeposition of legumes[J]. Agronomy for Sustainable Development, 2010, 30(1): 57-66.doi:10.1007/978-94-007-0394-0_38.
[11] Zhu Y Y, Chen H R, Fan J H, Wang Y Y, Li Y, Chen J B, Fan J X, Yang S S, Hu L P, Leung H, Mew T W, Teng P S, Wang Z H, Mundt C C. Genetic diversity and disease control in rice[J]. Nature, 2000, 406(6797):718-722. doi:10.1038/35021046.
[12] Boudreau M A.Diseases in intercropping systems[J].Annual Review of Phytopathology, 2013, 51(1): 499-519. doi:10.1146/annurev-phyto-082712-102246.
[13] Lopes T, Hatt S, Xu Q X, Chen J L, Liu Y, Francis F. Wheat (Triticum aestivum L.)-based intercropping systems for biological pest control[J]. Pest Management Science, 2016, 72(12):2193-2202. doi:10.1002/ps.4332.
[14] Manevski K, Børgesen C D, Andersen M N, Kristensen I S. Reduced nitrogen leaching by intercropping maize with red fescue on sandy soils in North Europe: a combined field and modeling study[J]. Plant and Soil, 2015, 388(1-2):67-85. doi:10.1007/s11104-014-2311-6.
[15] Giller K E, Ormesher J, Awah F M. Nitrogen transfer from Phaseolus bean to intercropped maize measured using 15N-enrichment and 15N-isotope dilution methods[J]. Soil Biology and Biochemistry, 1991, 23(4): 339-346.doi:10.1016/0038-0717(91)90189-Q.
[16] Hauggaard-Nielsen H, Ambus P, Jensen E S. Interspecific competition, N use and interference with weeds in pea-barley intercropping[J]. Field Crops Research, 2001, 70(2): 101-109. doi:10.1016/s0378-4290(01)00126-5.
[17] Cong W F, Hoffland E, Li L, Six J, Sun J H, Bao X G, Zhang F S, Van Der Werf W. Intercropping enhances soil carbon and nitrogen[J]. Global Change Biology, 2015, 21(4):1715-1726. doi:10.1111/gcb.12738.
[18] Bedoussac L, Journet E P, Hauggaard-Nielsen H, Naudin C, Corre-Hellou G, Jensen E S, Prieur L, Justes E. Ecological principles underlying the increase of productivity achieved by cereal-grain legume intercrops in organic farming. a review[J]. Agronomy for Sustainable Development, 2015, 35(3):911-935. doi:10.1007/s13593-014-0277-7.
[19] Chapagain T, Riseman A.Barley-pea intercropping: effects on land productivity, carbon and nitrogen transformations[J]. Field Crops Research, 2014, 166(9): 18-25. doi:10.1016/j.fcr.2014.06.014.
[20] 刘宇, 章莹, 杨文亭, 李志贤, 管奥湄, 王建武. 减量施氮与大豆间作对蔗田氮平衡的影响[J]. 应用生态学报, 2015, 26(3): 817-825. doi:10.13287/j.1001-9332.20150106.002.
Liu Y, Zhang Y, Yang W T, Li Z X, Guan A M, Wang J W. Effects of reduced nitrogen application and soybean intercropping on nitrogen balance of sugarcane field[J]. Chinese Journal of Applied Ecology, 2015, 26(3):817-825.
[21] 冯晓敏, 杨永, 臧华栋, 钱欣, 胡跃高, 宋振伟, 张卫健, 曾昭海. 燕麦花生间作系统作物氮素累积与转移规律[J]. 植物营养与肥料学报, 2018, 24(3):617-624. doi:10.11674/zwyf.17226.
Feng X M, Yang Y, Zang H D, Qian X, Hu Y G, Song Z W, Zhang W J, Zeng Z H. Characteristics of crop nitrogen accumulation and nitrogen transfer in oat and peanut intercropping system[J]. Journal of Plant Nutrition and Fertilizers, 2018, 24(3):617-624.
[22] 赵财,柴强, 乔寅英, 王建康. 禾豆间距对间作豌豆“氮阻遏”减缓效应的影响[J]. 中国生态农业学报, 2016, 24(9):1169-1176. doi:10.13930/j.cnki.cjea.160289.
Zhao C, Chai Q, Qiao Y Y, Wang J K. Effect of cereal-legume spacing in intercropping system on alleviating “N inhibition” in pea plants[J]. Chinese Journal of Eco-Agriculture, 2016, 24(9):1169-1176.
[23] 贾曼曼, 肖靖秀, 汤利, 郑毅. 不同施氮量对小麦蚕豆间作作物产量及其光合特征的影响[J]. 云南农业大学学报(自然科学), 2017,32(2): 350-357. doi:10.16211/j.issn.1004-390X(n).2017.02.022.
Jia M M, Xiao J X, Tang L, Zheng Y. Effects of nitrogen supply on yields and photosynthesis characteristics of crops in wheat and broad bean intercropping[J]. Journal of Yunnan Agricultural University, 2017,32(2):350-357.
[24] 肖靖秀, 周桂夙, 汤利, 郑毅, 李永梅, 李隆. 小麦/蚕豆间作条件下小麦的氮、钾营养对小麦白粉病的影响[J]. 植物营养与肥料学报, 2006,12(4):517-522. doi:10.3321/j.issn:1008-505X.2006.04.010.
Xiao J X, Zhou G S, Tang L, Zheng Y, Li Y M, Li L. Effects of nitrogen and potassium nutrition on the occurence of Blumeria graminis(DC).Speer of wheat in wheat and faba bean intercropping[J].Journal of Plant Nutrition and Fertilizers, 2006,12(4):517-522.
[25] Trinder C, Brooker R, Davidson H, Robinson D. Dynamic trajectories of growth and nitrogen capture by competing plants[J]. New Phytologist, 2012, 193(4):948-958. doi:10.1111/j.1469-8137.2011.04020.x.
[26] Zhang W P, Liu G C, Sun J H, Zhang L Z, Weiner J, Li L. Growth trajectories and interspecific competitive dynamics in wheat/maize and barley/maize intercropping[J]. Plant and Soil, 2015, 397(1-2):227-238. doi:10.1007/s11104-015-2619-x.
[27] Damgaard C, Weiner J, Nagashima H. Modelling individual growth and competition in plant populations: growth curves of Chenopodium album at two densities[J]. Journal of Ecology, 2002, 90(4):666-671.doi:10.1046/j.1365-2745.2002.00700.x.
[28] Willey R W. Resource use in intercropping systems[J]. Agricultural Water Management, 1990, 17(1-3):215-231.doi:10.1016/0378-3774(90)90069-B.
[29] 肖靖秀, 汤利, 郑毅, 董艳. 大麦/蚕豆间作条件下供氮水平对作物产量和大麦氮吸收累积的影响[J]. 麦类作物学报, 2011, 31(3): 499-503.doi:10.7606/j.issn.1009-1041.2011.03.020.
Xiao J X, Tang L, Zheng Y, Dong Y. Effects of N level on yield of crops,N absorption and accumulation of barley in barley and faba bean intercropping system[J]. Journal of Triticeae Crops, 2011, 31(3):499-503.
[30] Li L, Sun J H, Zhang F S, Li X L, Yang S C, Rengel Z. Wheat/maize or wheat/soybean strip intercropping: I. yield advantage and interspecific interactions on nutrients[J]. Field Crops Research, 2001, 71(2):123-137.doi:10.1016/s0378-4290(01)00156-3.
[31] Zhang F S, Li L. Using competitive and facilitative interactions in intercropping systems enhances crop productivity and nutrient-use efficiency[J]. Plant and Soil, 2003, 248(1-2):305-312.doi:10.1023/a:1022352229863.
[32] Xiao Y B, Li L, Zhang F S. Effect of root contact on interspecific competition and N transfer between wheat and fababean using direct and indirect 15N techniques[J]. Plant and Soil, 2004, 262(1-2):45-54.doi:10.1023/b:plso.0000037019.34719.0d.
[33] 柏文恋, 张梦瑶, 任家兵, 汤利, 郑毅, 肖靖秀. 小麦/蚕豆间作作物生长曲线的模拟及种间互作分析[J]. 应用生态学报, 2018, 29(12):4037-4046. doi:10.13287/j.1001-9332.201812.026.
Bai W L, Zhang M Y, Ren J B, Tang L, Zheng Y,Xiao J X. Simulation of crop growth curve and analysis of interspecific interaction in wheat and faba bean intercropping system[J]. Chinese Journal of Applied Ecology, 2018, 29(12):4037-4046.
[34] 李春杰. 种内/种间互作调控小麦/蚕豆间作体系作物生长与氮磷吸收的机制[D].北京:中国农业大学,2018.
Li C J. The mechanisms of intra and specific interspecific interaction on regulating growth and N/P acquisition by intercropped wheat and fababean[D]. Beijing:China Agricultural University, 2018.
[35] 肖靖秀, 郑毅, 汤利,王戈, 董艳. 间作小麦蚕豆不同生长期根际有机酸和酚酸变化[J]. 土壤学报, 2016, 53(3):685-693.doi:10.11766/trxb201508180222.
Xiao J X,Zheng Y,Tang L,Wang G,Dong Y. Changes in organic and phenolic acids in rhizosphere of interplanted wheat and faba bean with growth stage[J]. Acta Pedologica Sinica, 2016, 53(3): 686-693.
[36] Liu Y C, Qin X M, Xiao J X, Tang L, Wei C Z, Wei J J, Zheng Y.Intercropping influences component and content change of flavonoids in root exudates and nodulation of Faba bean[J]. Journal of Plant Interactions, 2017, 12(1):187-192.doi:10.1080/17429145.2017.1308569.
[37] Li B, Li Y Y, Wu H M, Zhang F F, Li C J,Li X X,Lambers H,Li L. Root exudates drive interspecific facilitation by enhancing nodulation and N2 fixation[J]. Proceedings of the National Academy of Sciences, 2016, 113(23):6496-6501. doi:10.1073/pnas.1523580113.
[38] 王宇蕴.不同抗性小麦与蚕豆间作对小麦根际速效养分和根际形态的影响[D].昆明:云南农业大学,2010.
Wang Y Y. Effects of wheat cultivars with different disease resistance and fababean intercropping on rhizosphere on the available nutrient and root morphology of wheat[D]. Kunming:Yunnan Agricultural University, 2010.
[39] Katerji N, Mastrorilli M, van Hoorn J W, Lahmer F Z, Hamdy A, Oweis T. Durum wheat and barley productivity in saline-drought environments[J]. European Journal of Agronomy, 2009, 31(1):1-9.doi:10.1016/j.eja.2009.01.003.
[40] 代立芹,李春强, 魏瑞江, 姚树然, 郭淑静. 河北省冬小麦生长和产量对气候变化的响应[J]. 干旱区研究, 2011, 28(2):294-300.doi:10.13866/j.azr.2011.02.007.
Dai L Q, Li C Q, Wei R J, Yao S R, Guo S J. Response of growth and yield of winter wheat to climate change in Hebei Province[J]. Arid Zone Research, 2011, 28(2):294-300.
[41] 成林, 李彤霄, 刘荣花. 主要生育期气候变化对河南省冬小麦生长及产量的影响[J]. 中国生态农业学报, 2017, 25(6): 931-940.doi:10.13930/j.cnki.cjea.161054.
Cheng L, Li T X, Liu R H. Effect of climate change on growth and yield of winter wheat in Henan Province[J]. Chinese Journal of Eco-Agriculture, 2017, 25(6): 931-940.
