配合力是作物杂交育种中衡量亲本组配能力的一项重要指标,分为一般配合力(General combining ability,GCA)与特殊配合力(Special combining ability,SCA)[1]。其中,一般配合力(GCA)相对于特殊配合力(SCA)来说,是可遗传部分[2],是评价自交系育种潜力的前提基础,在水稻、玉米、小麦育种上已被广泛应用[3-7]。
在大麦GCA研究上,已有研究表明大麦产量、株高、蛋白质含量及开颖角度等性状的GCA有显著差异,可筛选到优良亲本[8-13]。本研究前期也显示,不同性状大麦基因型间GCA效应值不同[14],可筛选高GCA育种亲本。然而,配合力的分析结果受所选亲本及环境等因素影响[13,15]。为此,本研究选取我国不同产区大麦新品种(系)为材料,连续2年考查产量相关性状GCA差异,以期为不同类型大麦品种间杂交育种与亲本选配提供指导依据。
1 材料和方法
1.1 参试材料
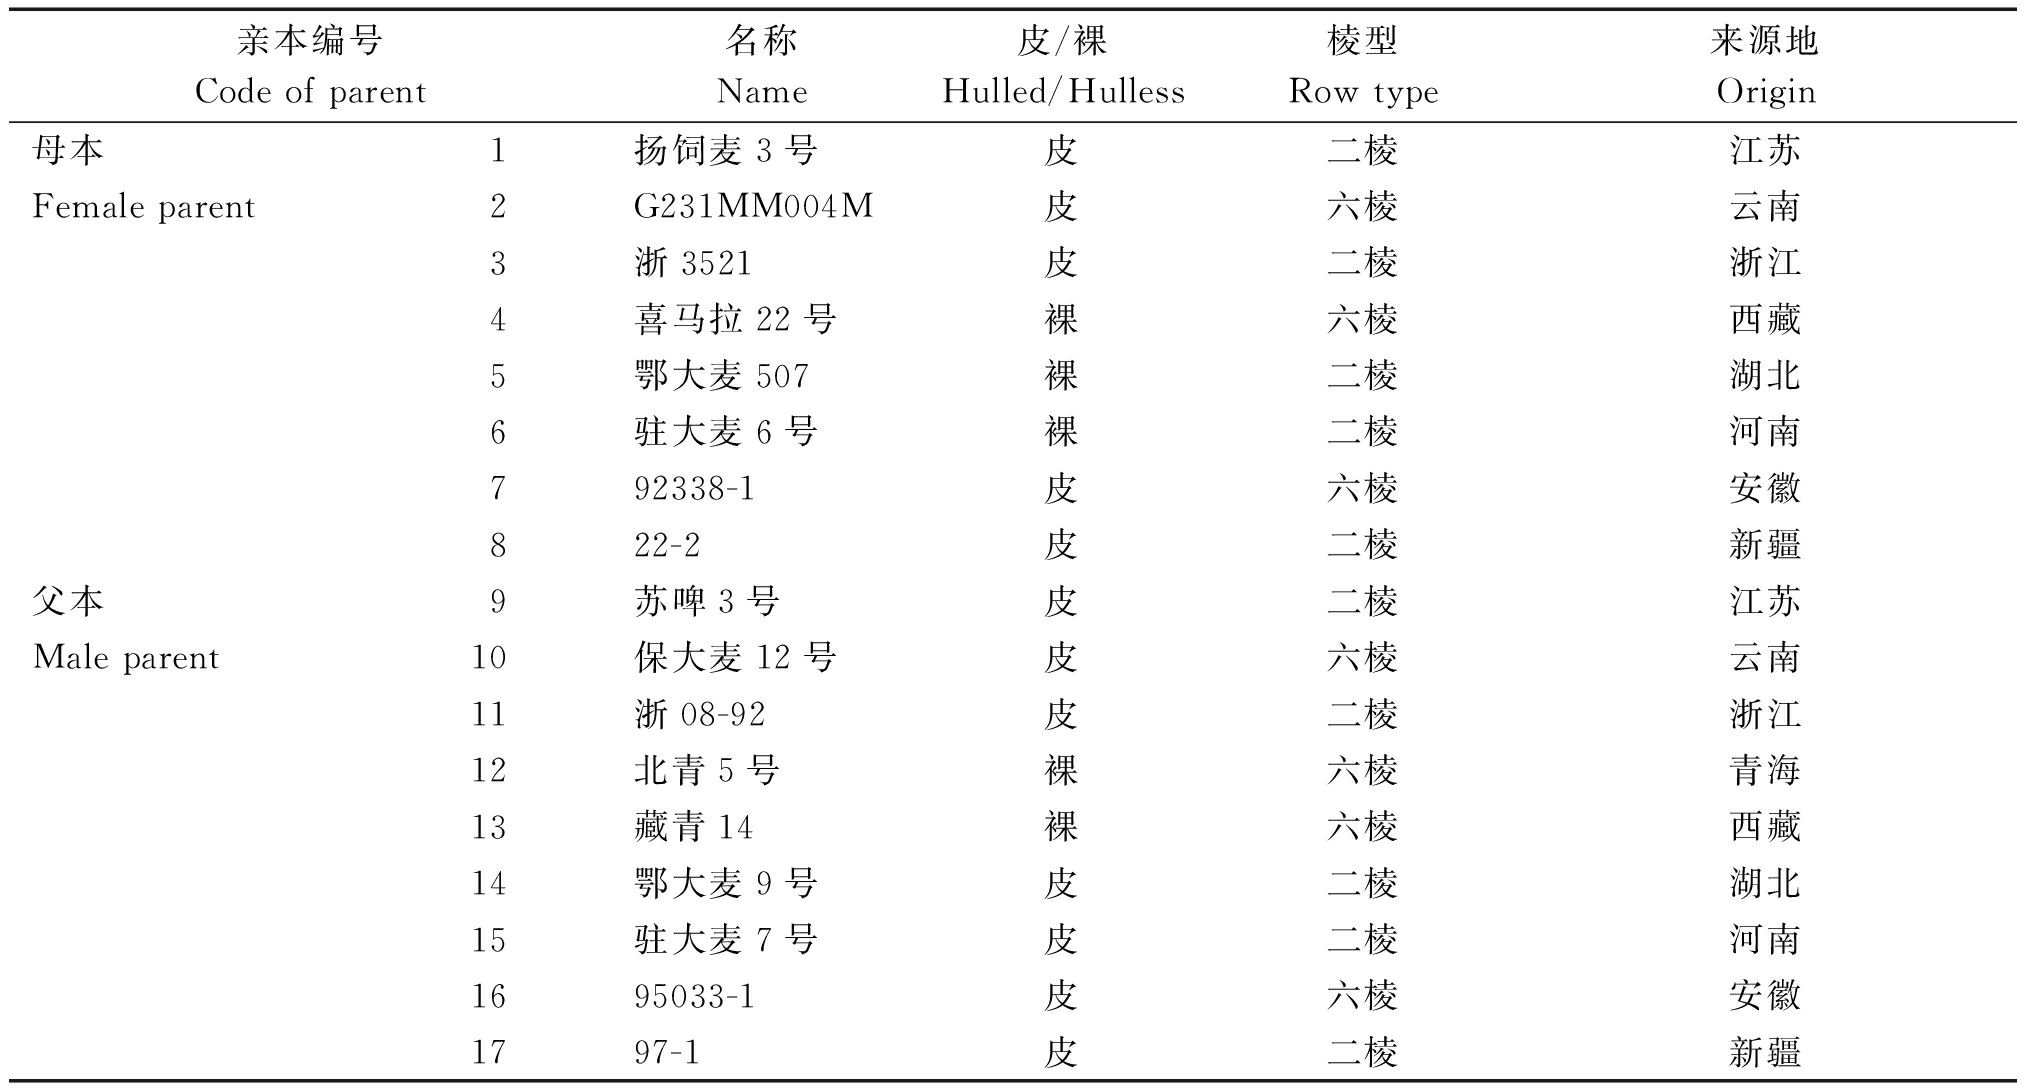
以我国不同产区具代表性的17份大麦新品种(系)为参试亲本,按NCⅡ设计配制成72个F1组合,亲本编号1~8为母本,9~17为父本,亲本的名称、皮裸、棱型及来源地见表1。
表1 参试大麦亲本编号、名称、皮裸、棱型及来源地
Tab.1 Summary of code,name,shell attribute,row type and origin of barley parents in the experiment

亲本编号Code of parent名称Name皮/裸Hulled/Hulless棱型Row type来源地Origin母本1扬饲麦3号 皮 二棱 江苏 Female parent2G231MM004M皮 六棱 云南 3浙3521皮 二棱 浙江 4喜马拉22号 裸六棱 西藏 5鄂大麦507 裸 二棱 湖北6驻大麦6号 裸 二棱 河南 792338-1皮 六棱 安徽 822-2皮 二棱 新疆 父本9苏啤3号 皮 二棱江苏Male parent10保大麦12号 皮六棱云南 11浙08-92 皮二棱浙江 12北青5号裸 六棱 青海13藏青14 裸 六棱 西藏 14鄂大麦9号 皮 二棱 湖北15驻大麦7号 皮二棱 河南1695033-1皮 六棱 安徽 1797-1皮 二棱 新疆
1.2 田间试验设计
将参试亲本及F1材料连续2年(2014-2016年)种植于安徽省农业科学院试验基地,随机排列,3次重复,每份材料种1行,行长2 m,行距0.25 m,株距0.05 m。常规田间管理,于大麦成熟期取样考种。
1.3 测定指标与方法
成熟后,于行中间对参试材料每重复随机取样10株待测,测定的7个产量相关性状分别是株高、穗长、穗下节间长、单株穗数、穗粒数、千粒质量及单株粒质量。
1.4 统计分析
配合力分析模型为yijk=μ+gi+gj+sij+εijk,其中μ为所有组合总体均值,gi为母本一般配合力效应(GCA),gj为父本一般配合力效应(GCA),sij为两亲本互作效应,即特殊配合力效应(SCA),εijk为误差。相关数据的处理与分析采用SAS 8.1软件包执行。
2 结果与分析
2.1 产量相关性状的配合力方差分析
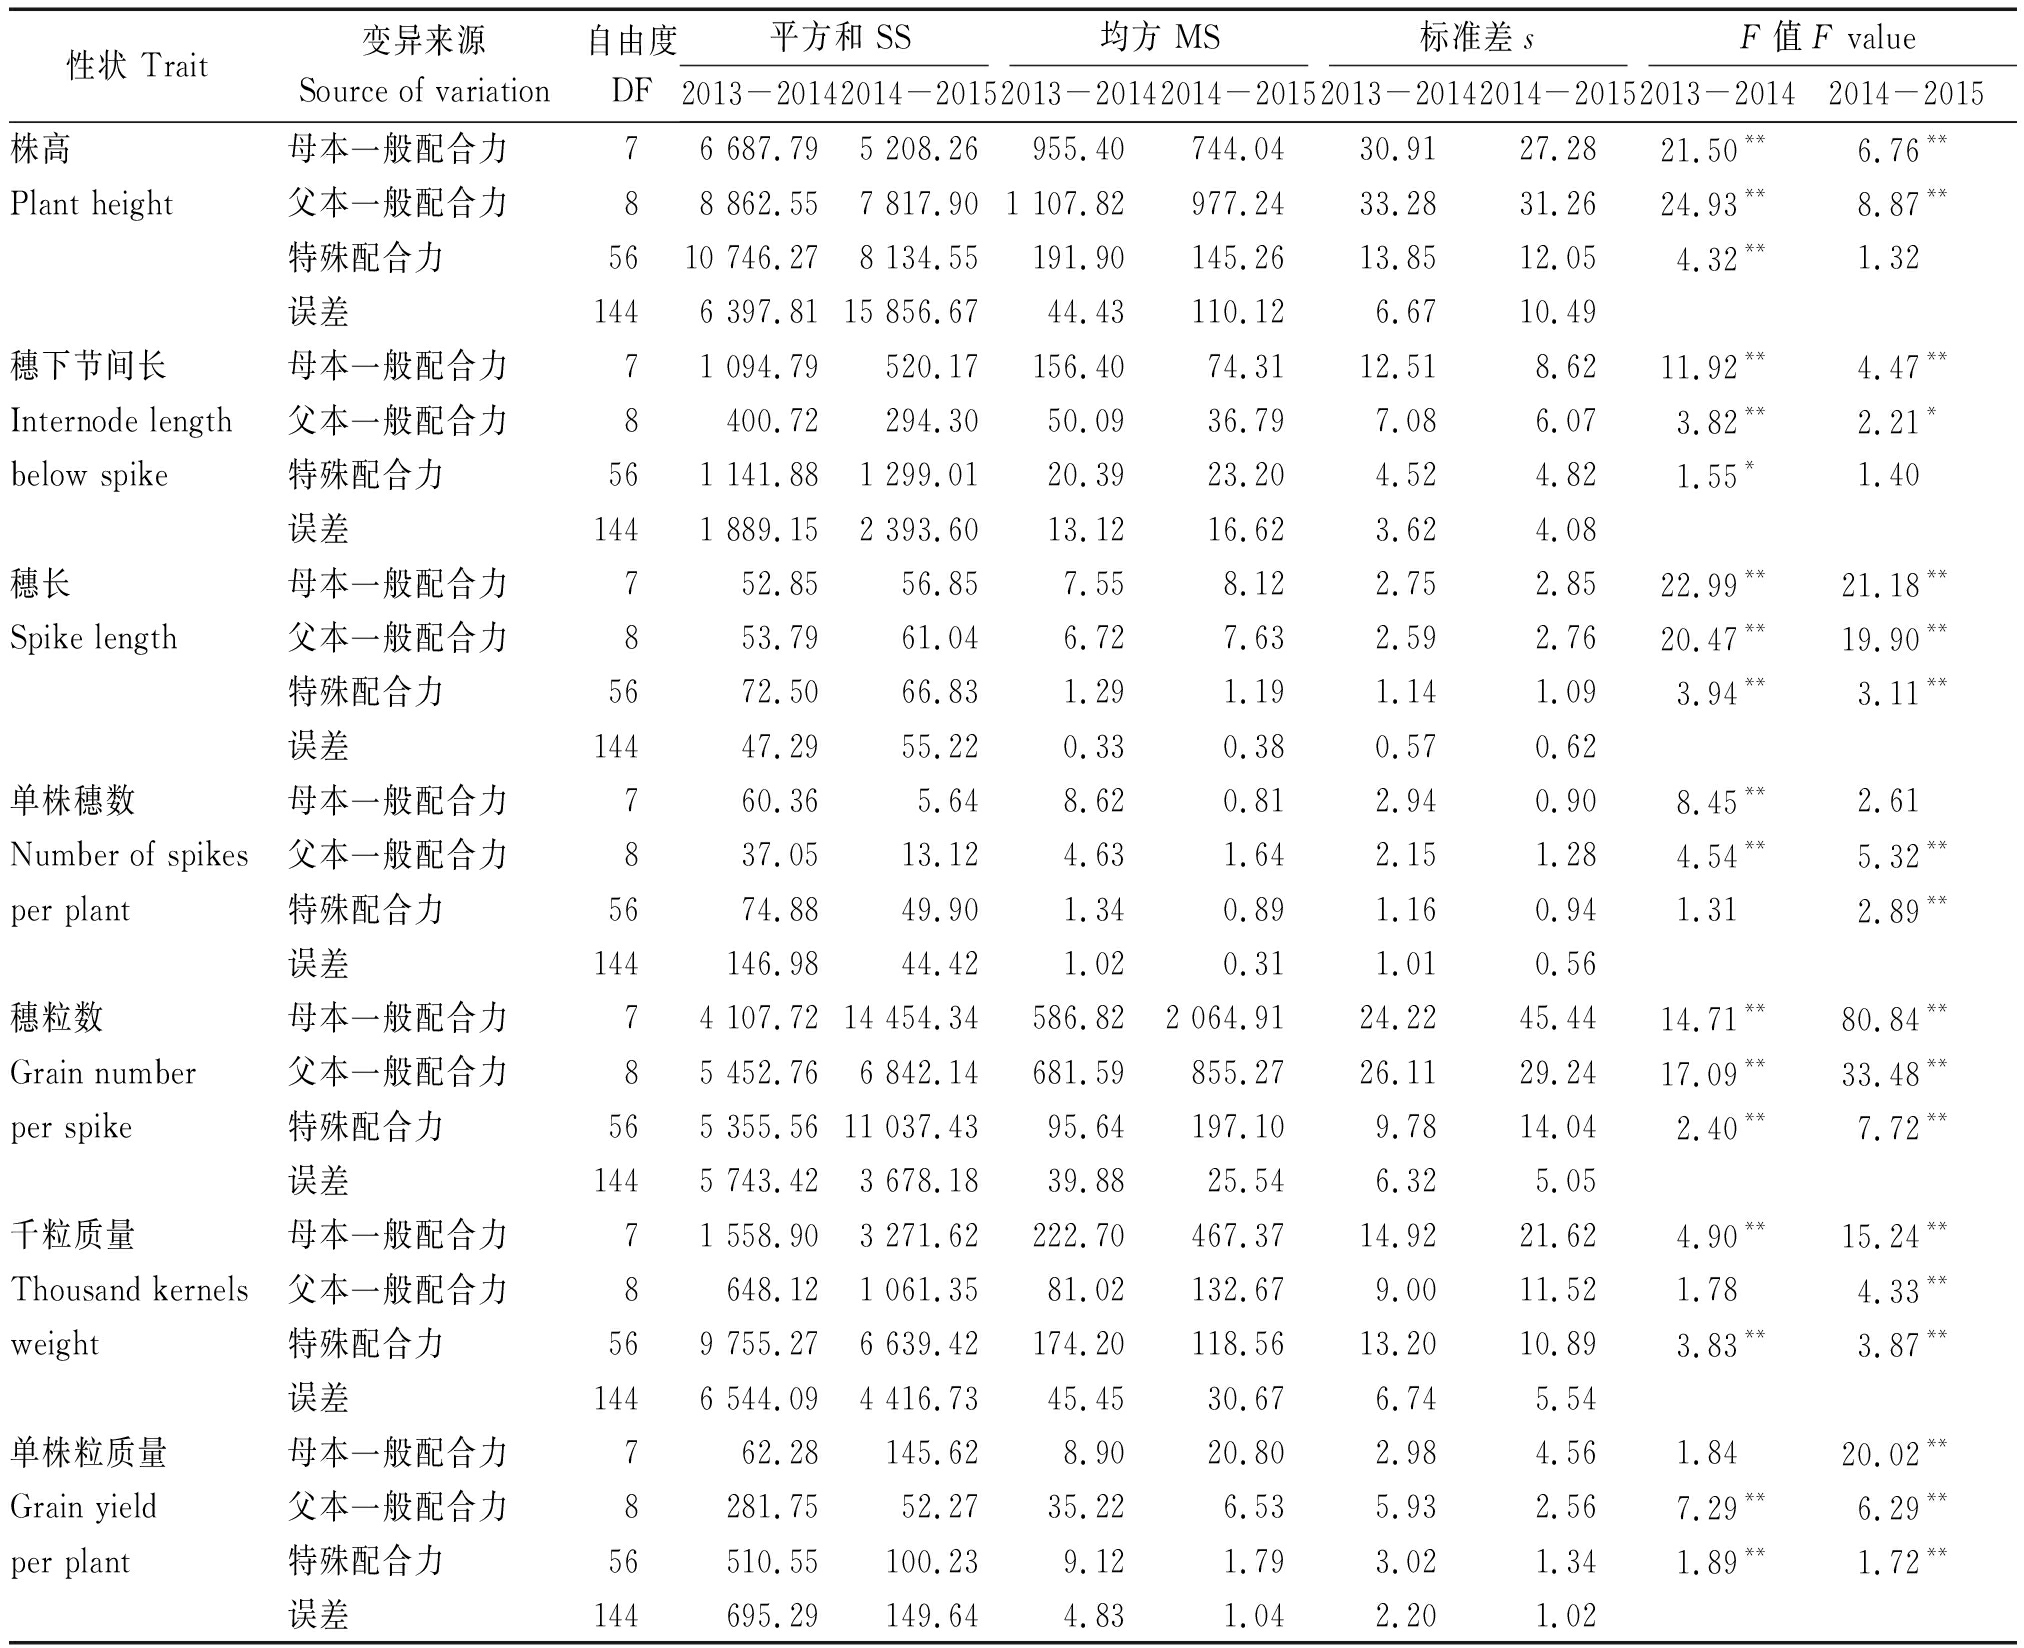
大麦产量相关性状配合力方差分析结果显示(表2),所有性状GCA与SCA方差在单年度或两年度达显著或极显著差异,其中穗长与穗粒数表现尤为突出,GCA与SCA方差2年均呈极显著差异,表明基因加性效应与非加性效应同时存在。所有性状GCA方差普遍大于SCA方差,除单株穗数、千粒质量、单株粒质量在单年度检测到个别相反结果,说明产量相关性状的遗传变异主要受基因的加性效应调控,可稳定遗传。
表2 产量相关性状的配合力方差分析
Tab.2 Variance analysis of combining ability for yield related traits

性状 Trait变异来源Source of variation自由度DF平方和 SS均方 MS标准差sF值 F value2013-20142014-20152013-20142014-20152013-20142014-20152013-20142014-2015株高母本一般配合力 76 687.79 5 208.26 955.40 744.04 30.91 27.28 21.50**6.76**Plant height父本一般配合力88 862.55 7 817.90 1 107.82 977.24 33.28 31.26 24.93**8.87**特殊配合力 5610 746.27 8 134.55 191.90 145.26 13.85 12.05 4.32**1.32 误差 1446 397.81 15 856.67 44.43 110.12 6.67 10.49 穗下节间长母本一般配合力71 094.79 520.17 156.40 74.31 12.51 8.62 11.92**4.47**Internode length父本一般配合力 8400.72 294.30 50.09 36.79 7.08 6.07 3.82**2.21* below spike特殊配合力 561 141.88 1 299.01 20.39 23.20 4.52 4.82 1.55*1.40 误差1441 889.15 2 393.60 13.12 16.62 3.62 4.08 穗长母本一般配合力 752.85 56.85 7.55 8.12 2.75 2.85 22.99**21.18**Spike length父本一般配合力 853.79 61.04 6.72 7.63 2.59 2.76 20.47**19.90**特殊配合力5672.50 66.83 1.29 1.19 1.14 1.09 3.94**3.11**误差 14447.29 55.22 0.33 0.38 0.57 0.62 单株穗数 母本一般配合力 760.36 5.64 8.62 0.81 2.94 0.90 8.45**2.61 Number of spikes父本一般配合力 837.05 13.12 4.63 1.64 2.15 1.28 4.54**5.32**per plant特殊配合力 5674.88 49.90 1.34 0.89 1.16 0.94 1.31 2.89**误差144146.98 44.42 1.02 0.31 1.01 0.56 穗粒数 母本一般配合力 74 107.72 14 454.34 586.82 2 064.91 24.22 45.44 14.71**80.84**Grain number父本一般配合力 85 452.76 6 842.14 681.59 855.27 26.11 29.24 17.09**33.48**per spike特殊配合力565 355.56 11 037.43 95.64 197.10 9.78 14.04 2.40**7.72**误差 1445 743.42 3 678.18 39.88 25.54 6.32 5.05 千粒质量 母本一般配合力 71 558.90 3 271.62 222.70 467.37 14.92 21.62 4.90**15.24**Thousand kernels父本一般配合力 8648.12 1 061.35 81.02 132.67 9.00 11.52 1.78 4.33**weight特殊配合力 569 755.27 6 639.42 174.20 118.56 13.20 10.89 3.83**3.87**误差 1446 544.09 4 416.73 45.45 30.67 6.74 5.54 单株粒质量 母本一般配合力762.28 145.62 8.90 20.80 2.98 4.56 1.84 20.02**Grain yield父本一般配合力8281.75 52.27 35.22 6.53 5.93 2.56 7.29**6.29**per plant特殊配合力 56510.55 100.23 9.12 1.79 3.02 1.34 1.89**1.72**误差 144695.29 149.64 4.83 1.04 2.20 1.02
注:*和**分别表示在P<0.05和P<0.01水平上差异显著。表4同。
Note:* and**indicate significant differences at 0.05 and 0.01 level,respectively.The same as Tab.4.
2.2 一般配合力的差异比较
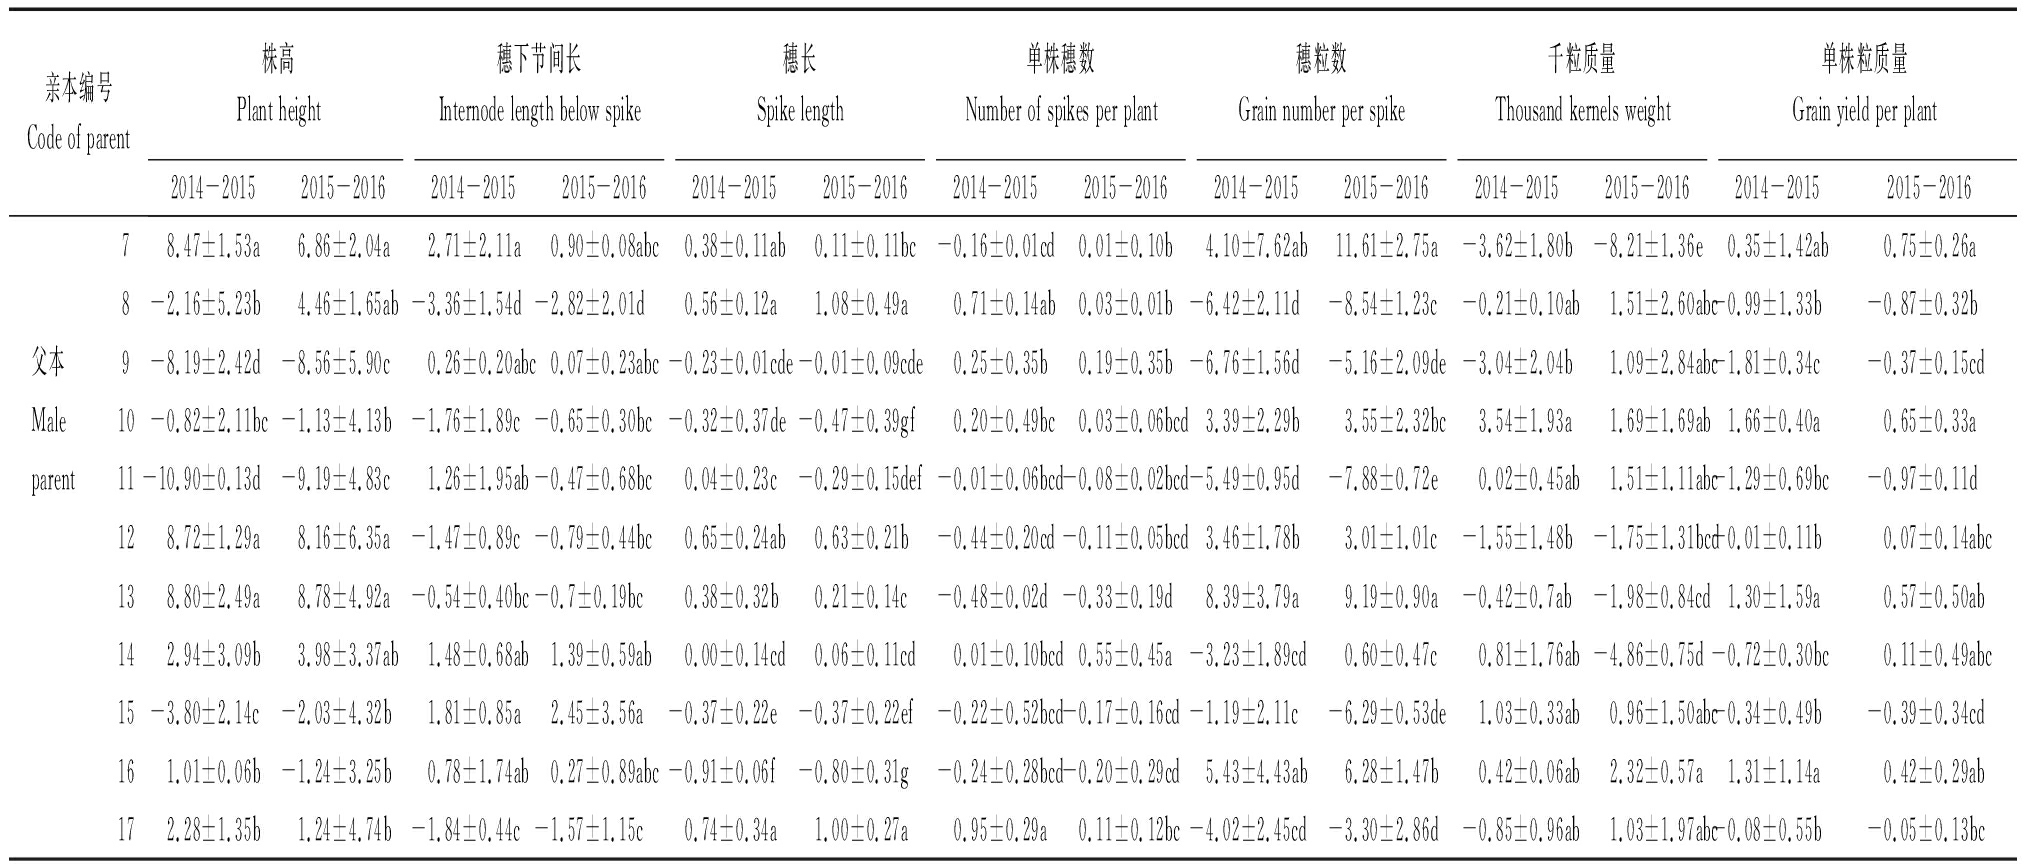
由表3可知,所有产量相关性状GCA在亲本间均呈显著差异,同一亲本不同性状GCA表现不同。依据2年产量相关性状GCA效应值,高GCA亲本分别为株高(4、7、12、13)、穗下节间长(6、15)、穗长(8、17)、单株穗数(5、17)、穗粒数(4、7、13、16)、千粒质量(5、6、10、16)、单株粒质量(10、16)。从棱型来看,穗下节间长、穗长与单株穗数高GCA亲本是二棱大麦,株高、每穗粒数与单株粒质量高GCA亲本是六棱大麦,千粒质量高GCA亲本2种棱型皆有。因此,应针对目标性状选择高GCA亲本进行组配,提高后代选择效率。
表3 产量相关性状一般配合力的差异比较
Tab.3 Comparison of differences in general combining ability for yield related traits

亲本编号Code of parent株高Plant height穗下节间长Internode length below spike穗长Spike length单株穗数Number of spikes per plant穗粒数Grain number per spike千粒质量Thousand kernels weight单株粒质量Grain yield per plant2014-20152015-20162014-20152015-20162014-20152015-20162014-20152015-20162014-20152015-20162014-20152015-20162014-20152015-2016母本1-1.68±0.80b-1.22±6.46bc1.85±2.22ab2.45±0.87a-0.24±0.17d-0.40±0.36de-0.36±0.27d-0.06±0.2b-3.63±1.88cd-7.11±1.31c3.12±0.33a2.50±2.15ab-0.67±0.46ab-0.81±0.67bFemale2-5.12±0.90b-8.54±2.43d-3.28±1.96d-1.40±0.33cd0.11±0.10bc-0.15±0.15cd-0.47±0.22d0.02±0.01b2.33±0.60b3.80±2.31b0.27±1.70ab0.22±0.10bc0.06±0.04ab0.58±0.22aparent3-1.49±2.56b0.39±2.45bc-1.02±1.82c-0.22±0.06bc-0.94±0.33e-0.55±0.07e-0.32±0.19d0.35±0.01a3.50±2.80ab5.17±1.25b-2.96±0.57b-1.28±0.34cd-0.01±0.73ab0.89±0.45a410.28±2.97a4.91±0.11ab-0.05±0.73bc0.23±2.01abc-0.11±0.15cd0.25±0.18b-0.58±0.10d-0.22±0.34b6.47±4.60a10.68±1.54a-2.65±0.30b-3.01±0.40d0.05±0.11ab1.03±0.45a5-4.46±3.01b-4.83±6.52cd0.66±0.57abc-0.59±0.29bcd0.62±0.24a0.21±0.29b0.92±0.11a0.02±0.01b-3.89±0.75cd-8.22±1.79c2.30±1.96a4.05±3.31a0.64±0.15a-0.61±0.66b6-3.8±1.79b-2.02±2.56c2.49±0.94a1.45±1.08ab-0.39±0.02d-0.58±0.27e0.26±0.20bc-0.17±0.26b-2.49±0.60c-7.37±1.10c3.71±1.59a4.25±1.01a0.60±0.29a-0.93±0.33b
表3(续)

亲本编号Code of parent株高Plant height穗下节间长Internode length below spike穗长Spike length单株穗数Number of spikes per plant穗粒数Grain number per spike千粒质量Thousand kernels weight单株粒质量Grain yield per plant2014-20152015-20162014-20152015-20162014-20152015-20162014-20152015-20162014-20152015-20162014-20152015-20162014-20152015-201678.47±1.53a6.86±2.04a2.71±2.11a0.90±0.08abc0.38±0.11ab0.11±0.11bc-0.16±0.01cd0.01±0.10b4.10±7.62ab11.61±2.75a-3.62±1.80b-8.21±1.36e0.35±1.42ab0.75±0.26a8-2.16±5.23b4.46±1.65ab-3.36±1.54d-2.82±2.01d0.56±0.12a1.08±0.49a0.71±0.14ab0.03±0.01b-6.42±2.11d-8.54±1.23c-0.21±0.10ab1.51±2.60abc-0.99±1.33b-0.87±0.32b父本9-8.19±2.42d-8.56±5.90c0.26±0.20abc0.07±0.23abc-0.23±0.01cde-0.01±0.09cde0.25±0.35b0.19±0.35b-6.76±1.56d-5.16±2.09de-3.04±2.04b1.09±2.84abc-1.81±0.34c-0.37±0.15cdMale10-0.82±2.11bc-1.13±4.13b-1.76±1.89c-0.65±0.30bc-0.32±0.37de-0.47±0.39gf0.20±0.49bc0.03±0.06bcd3.39±2.29b3.55±2.32bc3.54±1.93a1.69±1.69ab1.66±0.40a0.65±0.33aparent11-10.90±0.13d-9.19±4.83c1.26±1.95ab-0.47±0.68bc0.04±0.23c-0.29±0.15def-0.01±0.06bcd-0.08±0.02bcd-5.49±0.95d-7.88±0.72e0.02±0.45ab1.51±1.11abc-1.29±0.69bc-0.97±0.11d128.72±1.29a8.16±6.35a-1.47±0.89c-0.79±0.44bc0.65±0.24ab0.63±0.21b-0.44±0.20cd-0.11±0.05bcd3.46±1.78b3.01±1.01c-1.55±1.48b-1.75±1.31bcd-0.01±0.11b0.07±0.14abc138.80±2.49a8.78±4.92a-0.54±0.40bc-0.7±0.19bc0.38±0.32b0.21±0.14c-0.48±0.02d-0.33±0.19d8.39±3.79a9.19±0.90a-0.42±0.7ab-1.98±0.84cd1.30±1.59a0.57±0.50ab142.94±3.09b3.98±3.37ab1.48±0.68ab1.39±0.59ab0.00±0.14cd0.06±0.11cd0.01±0.10bcd0.55±0.45a-3.23±1.89cd0.60±0.47c0.81±1.76ab-4.86±0.75d-0.72±0.30bc0.11±0.49abc15-3.80±2.14c-2.03±4.32b1.81±0.85a2.45±3.56a-0.37±0.22e-0.37±0.22ef-0.22±0.52bcd-0.17±0.16cd-1.19±2.11c-6.29±0.53de1.03±0.33ab0.96±1.50abc-0.34±0.49b-0.39±0.34cd161.01±0.06b-1.24±3.25b0.78±1.74ab0.27±0.89abc-0.91±0.06f-0.80±0.31g-0.24±0.28bcd-0.20±0.29cd5.43±4.43ab6.28±1.47b0.42±0.06ab2.32±0.57a1.31±1.14a0.42±0.29ab172.28±1.35b1.24±4.74b-1.84±0.44c-1.57±1.15c0.74±0.34a1.00±0.27a0.95±0.29a0.11±0.12bc-4.02±2.45cd-3.30±2.86d-0.85±0.96ab1.03±1.97abc-0.08±0.55b-0.05±0.13bc
注:同列同组数据后不同小写字母表示在P<0.05水平上差异显著。
Note:Different lower case letters following data within the same column and group indicate significant difference at 0.05 level.
2.3 性状本身与一般配合力的相关性
亲本性状值与其GCA值相关性分析结果(表4)表明,株高、穗下节间长、穗长及穗粒数性状值与各自GCA值呈极显著正相关,单株穗数与单株粒质量在单年度检测到与相应GCA值呈显著或极显著正相关,而千粒质量性状值与其GCA值相关不显著。因此,两者相关性在性状间表现不同,且受环境影响。
表4 产量相关性状值与其一般配合力的相关系数
Tab.4 Correlation coefficients of between values of trait and its general combining ability (GCA)

年份Year株高Plant height穗下节间长Internode length below spike穗长Spike length单株穗数Number of spikes per plant穗粒数Grain number per spike千粒质量Thousand kernels weight单株粒质量Grain yield per plant2014-20150.88**0.74**0.84**0.45 0.92**0.39 -0.482015-20160.87**0.70**0.81**0.58*0.84**0.25 0.71**
3 讨论与结论
3.1 配合力的变异与应用
本研究对7个大麦产量相关性状的GCA与SCA方差分析表明,调控性状变异的基因加性与非加性效应均普遍存在,与众多研究结果一致[16-19],其中加性效应为主要因素[16-17,20]。但也有研究显示,基因非加性效应可能较为重要[21-22]。本研究产量相关性状的GCA方差普遍大于SCA方差,因此在杂交育种中应以GCA为首要依据来指导亲本选配,与笔者前期研究结论一致[14]。也有研究指出,GCA变异相对于SCA变异受环境影响较小,表现更稳定[13,15]。本研究GCA与SCA变异的稳定性彼此间无明显差异,但在性状间表现不同,其中穗长与穗粒数的GCA与SCA方差在两年度均达极显著水平,而其余5个性状GCA或SCA方差在年度间存在差异。因此,针对大麦产量构成因子,穗粒数变异相对于单株穗数与千粒质量来说受环境影响较小,早期选择可靠性相对较高。
3.2 一般配合力的差异与亲本选配
本研究表明,所有性状亲本GCA均存在显著差异,与其他研究结果一致[8-10],可选择高GCA亲本进行组配。如本研究中16号亲本(95033-1)在穗粒数、千粒质量及单株粒质量3个性状上均表现高GCA,可作为优良亲本。此外,性状本身与其GCA可能高度相关[12,23],如本研究中株高、穗下节间长、穗长及穗粒数4个性状与各自GCA值呈极显著正相关,可通过性状值来预测GCA大小,指导亲本选配。然而,其余3个性状如千粒质量两年度均未检测到与其GCA相关,难以通过性状值预测其GCA表现。因此,性状与GCA间的关系较复杂,遗传基础可能不同[24],有待深入研究。
3.3 结论
基于上述,大麦产量相关性状GCA与SCA方差达显著或极显著差异,且GCA方差普遍大于SCA方差,说明调控性状的基因加性、非加性效应同时存在,以加性效应为主。针对目标性状可筛选到高GCA亲本,本研究亲本95033-1在穗粒数、千粒质量及单株粒质量3个性状上GCA值均较高,可作为优良亲本进行组配。性状值与相应GCA间的相关性因性状不同而不同。基于本研究,在对大麦株高、穗下节间长、穗长及穗粒数4个性状改良上,可通过亲本性状值预测其GCA值,从而指导亲本选配。
[1] Sprague G F,Tatuml A. General vs specific combining ability in single crosses of corn[J]. Journal of American Society of Agronomy,1942,34:923-933.
[2] Lv A,Zhang H,Zhang Z,et al. Conversion of the statistical combining ability into a genetic concept[J]. Journal of Integrative Agriculture,2012,11(1):43-52.
[3] Bagheri N,Jelodar N B. Heterosis and combining ability analysis for yield and related-yield traits in hybrid rice[J]. International Journal of Biology,2010,2(2):222-231.
[4] Tiwari D K,Pandey P,Giri S P,et al. Prediction of gene action,heterosis and combining ability to identify superior rice hybrids[J]. International Journal of Botany,2011,7(2):126-144.
[5] Guerrero C G,Robles M A G,Ortega J G L,et al. Combining ability and heterosis in corn breeding lines to forage and grain[J]. American Journal of Plant Sciences,2014,5:845-856.
[6] Gouda R K,Kage U,Lohithaswa H C,et al. Combining ability studies in maize(Zea Mays L.)[J]. Molecular Plant Breeding,2013,3(14):116-127.
[7] Kumar A,Mishra V K,Vyas R P,et al. Heterosis and combining ability analysis in bread wheat (Triticum aestivum L.)[J]. Journal of Plant Breeding and Crop Science,2011,3:209-217.
[8] Singh B,Sharma A,Joshi N,et al. Combining ability analysis for grain yield and its components in malt barley(Hordeum vulgare)[J]. Indian Journal of Agricultural Sciences,2013,83(1):96-98.
[9] Potla K R,Bornare S S,Prasad L C,et al. Study of heterosis and combining ability for yield and yield contributing traits in barley(Hordeum vulgare L.)[J]. The Bioscan,2013,8(4):1231-1235.
[10] Zhang X,Lv L,Lv C,et al. Combining ability of different agronomic traits and yield components in hybrid barley[J]. PLoS One,2015,10(6):e0126828.
[11] 李洪涛,王 军,张灿宏,等. 大麦株高及其构成因素的杂种优势和配合力分析[J]. 浙江农业学报,2015,27(2):141-147.
[12] 黄志仁,许如根,周美学,等. 6个大麦品种籽粒蛋白质含量的配合力分析[J]. 江苏农学院学报,1997,18(2):23-25.
[13] 兰国防,李洪涛,林 参,等. 大麦开颖角度的配合力及其稳定性分析[J]. 麦类作物学报,2014,34(1):48-53.
[14] 陈晓东,赵 斌,季昌好,等. 大麦农艺性状的杂种优势与配合力分析[J]. 中国农学通报,2014,30(36):69-73.
[15] 孙东发,赵 玲,徐廷文. 不同类型栽培大麦主要农艺性状的配合力及其稳定性研究[J]. 华中农业大学学报,1997,16(4):22-26.
[16] Pesaraklu S,Soltanloo H,Ramezanpour S S,et al. An estimation of the combining ability of barley genotypes and heterosis for some quantitative traits[J]. Iran Agricultural Research,2016,35(1):73-80.
[17] Shendy M Z. Estimation of heterosis,inbreeding depression and combining ability in six barley genotypes in both F1 and F2 genotypes[J]. Egyptian Journal of Plant Breeding,2015,19(4):1167-1182.
[18] Madakemohekar A H,Prasad L C,Lal J P,et al. Study of heterosis and combining ability in exotic and indigenous crosses of barley(Hordeum vulgare L.)under rainfed environment[J]. The Bioscan,2015,10(2):751-756.
[19] Ciulca A,Madosa E,Velicevici G,et al. Combining ability for some grains morphological traits in winter barley[J]. Journal of Horticulture,Forestry and Biotechnology,2015,19(3):67-72.
[20] 黄祖六,祝 丽,许如根,等. 大麦开颖性状的遗传分析Ⅱ.大麦开颖性状的杂种优势及配合力[J]. 麦类作物学报,2007,27(1):30-34.
[21] Moustafa E A,Mansour E. Estimation of combining ability and genetic components for yield contributing traits in spring barley under normal and salinity conditions[J]. Egyptian Journal of Agronomy,2016,38(3):431-453.
[22] 齐军仓,张 莉,曹连莆. 大麦籽粒蛋白质及其组份含量的配合力研究[J]. 麦类作物,1999,19(1):35-38.
[23] 黄志仁,周美学,黄友圣. 大麦籽粒蛋白质含量的配合力研究[J]. 遗传学报,1991,18(3):263-270.
[24] 胡文明,徐 扬,张恩盈,等. 基于QTL定位分析策略的一般配合力遗传基础研究[J]. 中国农业科学,2013,46(16):3305-3313.